

Multi Timeframe Trading in 3 steps

Multiple Timeframe Analysis is the trading equivalent of drinking more water … or flossing our teeth …. We all know we should be doing it, but for many of us, it’s one of those habits we have good intentions about, but it falls by the wayside.
We get so tied up in our main trading timeframe, watching for signals, that we’re resistant to mess that up by adding more information into the mix.
There’s only so much data most of us can cope with at a time, and adding an extra timeframe is the quickest way to double that data and become overwhelmed.
Here I want to show you simple but effective ways to add multiple timeframe analysis to your trading, without adding complexity – in fact, it’s going to simplify our trading and pare down our signals – as well as boosting returns and success rate.
Our three timeframe building blocks
There are no hard and fast rules for how you practise multi timeframe trading, but if we think about three key fundamentals, we can get our setup right …

The first timeframe is the FILTER – this is about putting your trading into the context of the wider market conditions. When we’re day trading, it’s far too easy to get bogged down and miss obvious signs in the markets.
The SIGNAL timeframe is probably the charts you feel most comfortable in – this is where we’re used to finding our trades.
The third timeframe is the TRIGGER – this is an opportunity to get into trades faster by zooming in on the candlesticks and looking at immediate price action. For anyone who’s hung around waiting for a candlestick to close in order to have a signal confirmed – this is a way to speed up that process and to push your reward-to-risk ratios.
So, let’s look at each of these in more detail …
Multi Timeframe Trading: The FILTER
When we ignore the bigger picture, it’s too easy to make some seriously stupid mistakes in our trading, like asking prices to move through long-term resistance to hit a profit target … putting stops just the wrong side of long-term support … or asking for a big move against the trend …
So, a glance at longer term charts is a powerful way to start your trading day. If you’re day trading, take a look at daily charts for your ‘big picture’ analysis. If you’re trading on hourly or 4-hourly charts, look at weekly candles at the beginning of each week.
Here’s a weekly chart for EURUSD to see what we can glean from it …
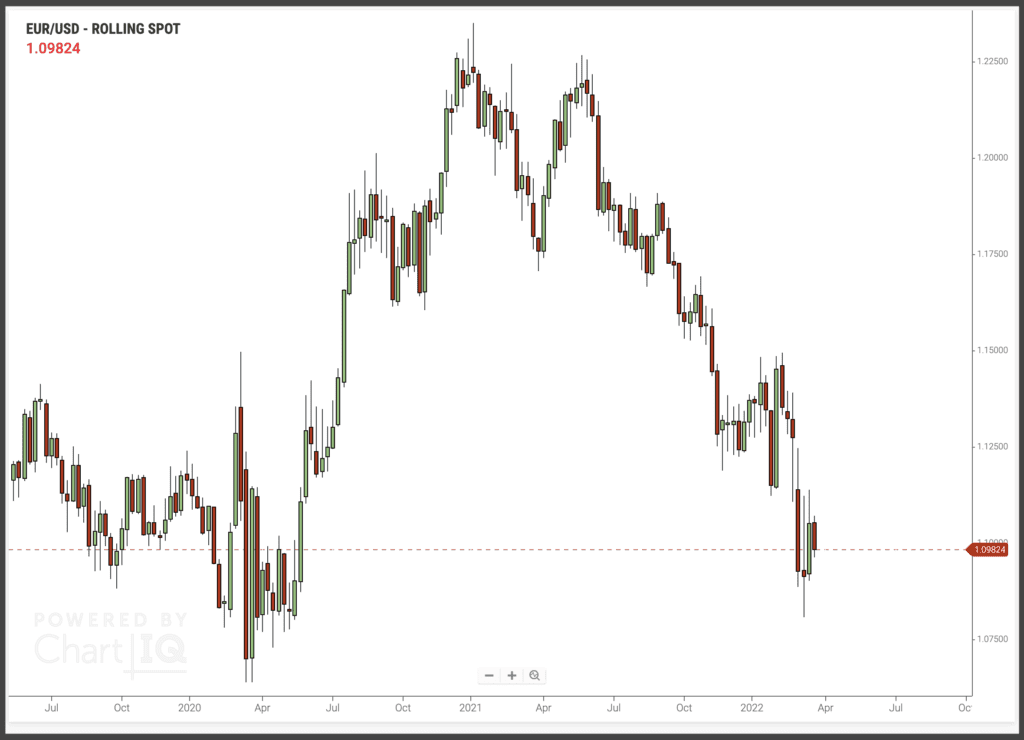
We’ll just focus in on what is likely to be relevant to us over the coming weeks, rather than worrying about levels that are a long way off current prices.
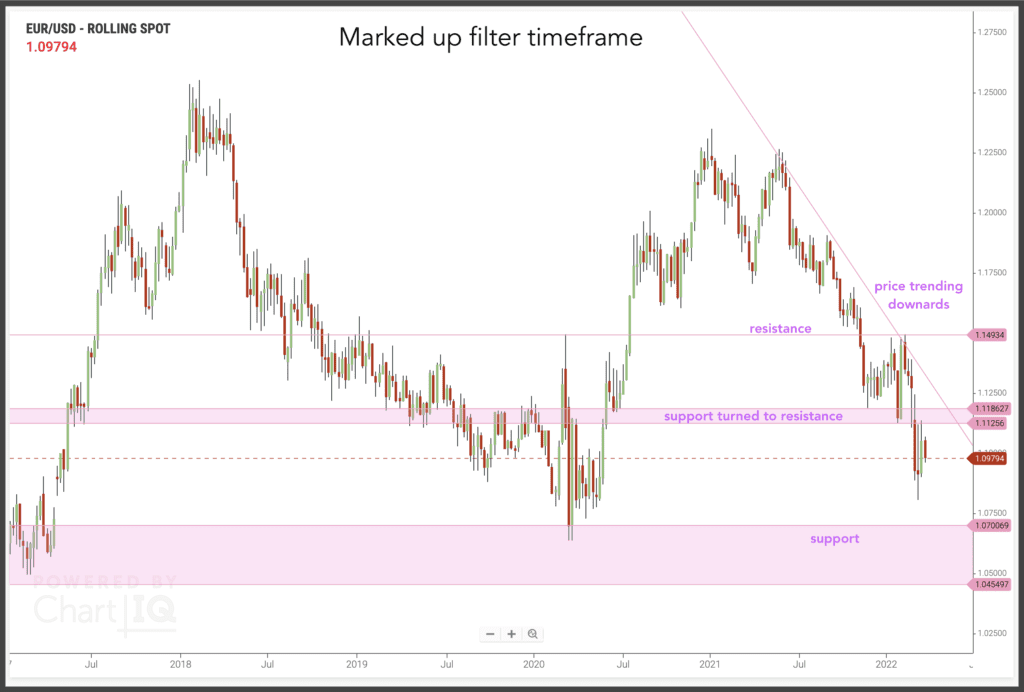
We can see that the price is in a downtrend, heading towards an area of long-term support around 1.0500/1.0700.
Plus, the price has recently moved below the 1.1120/80 level – an area of support turned to resistance.
Most charting packages will allow you to draw in and annotate on charts, so actually mark these levels up clearly. As once you’re zoomed back into shorter timeframes, you’ll quickly lose this frame of reference. I recommend using a different colour for these filter timeframe observations, so they’ll stand out against other markups you do over the course of the day or week.
From the chart above, we can see that any short trades will have more scope to run, along with some clear areas of resistance we could hope to see the price rebound from.
Multi Timeframe Trading: The SIGNAL
The signal timeframe is where traders probably spend most of their time analysing the markets. This is where we find our set-ups.
Looking at the chart from above, but now on a 4 hourly timeframe, we can see the move we’re looking for …

We want a conclusive move below the 1.0965 level, where we can sell, expecting the price to continue down, taking first profits above the recent low, and second profits above the area of support.
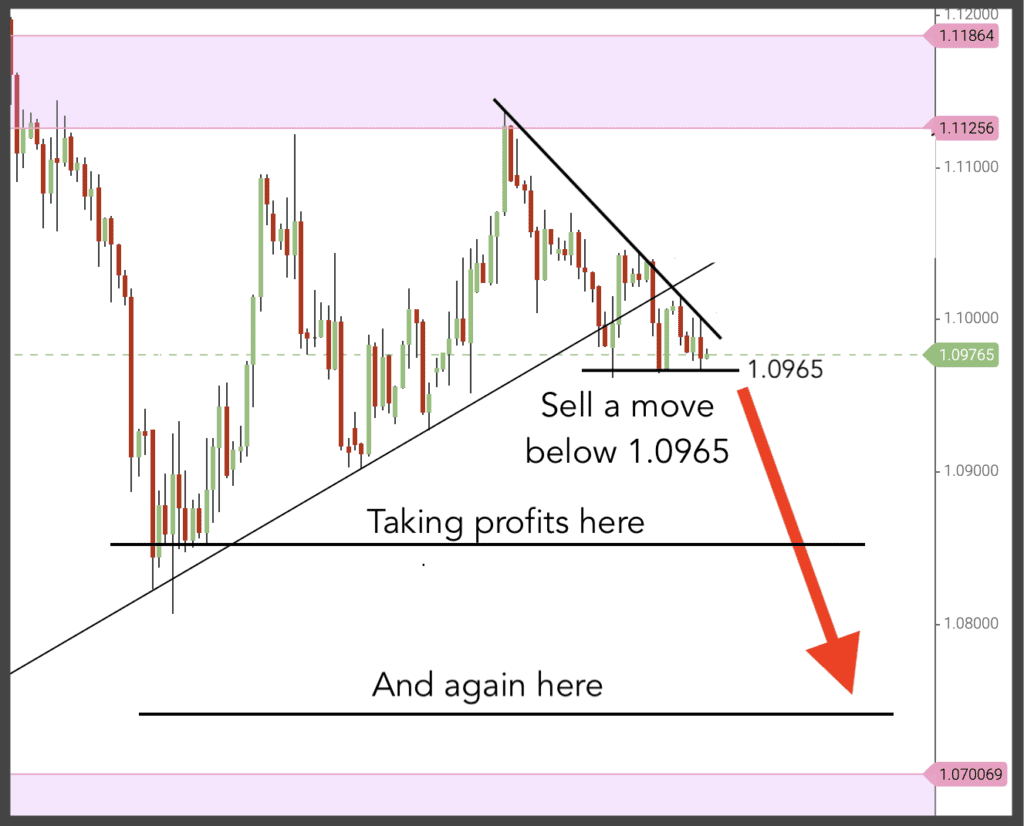
So, we’ve successfully used multiple timeframe analysis to give us this setup. By looking at the long-term chart, we’ve given our trade a better chance of success, taking into account the price direction and where historical support and resistance levels have fallen.
But there’s another step we can take to give us a better risk-reward profile …
Multi Timeframe Trading: The TRIGGER
So, we can sit and wait for the price to close below that 1.0965 level for our trade to be triggered. As this is trading on a 4 hourly chart, the price could move down significantly in that 4 hours, eating into a chunk of our profit. So, instead, we can zoom in again, looking for a faster entry.
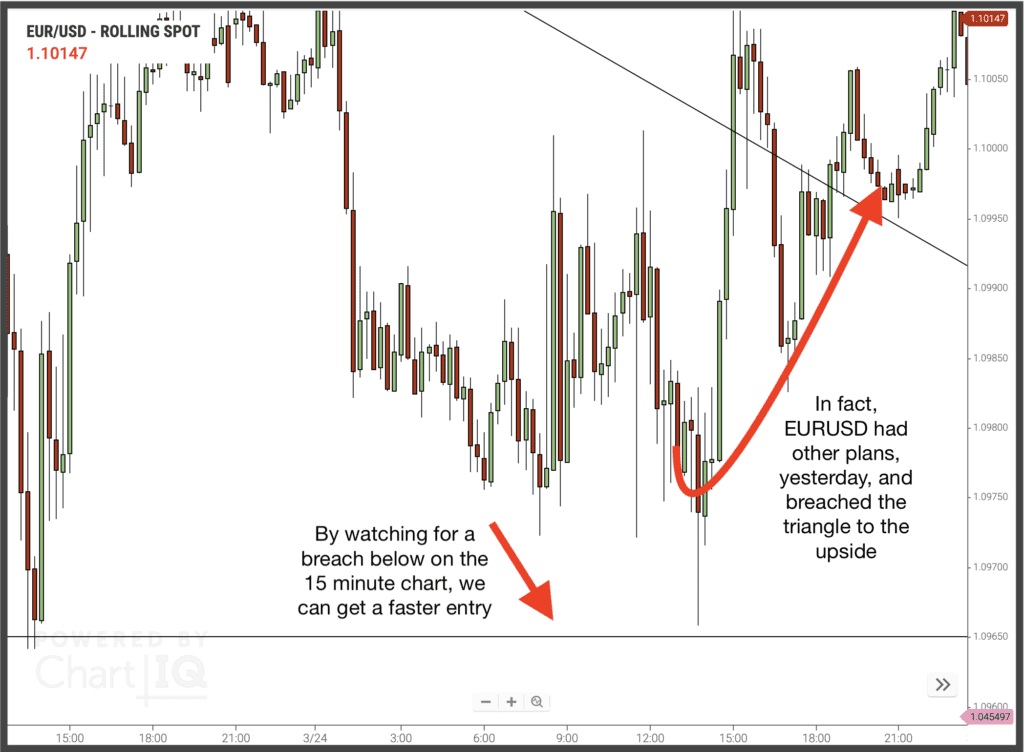
As you can see, the breach wasn’t triggered yesterday, but instead the price moved up instead.
Today’s EURUSD chart takes a slightly different form, with resistance forming around the 1.1040 …
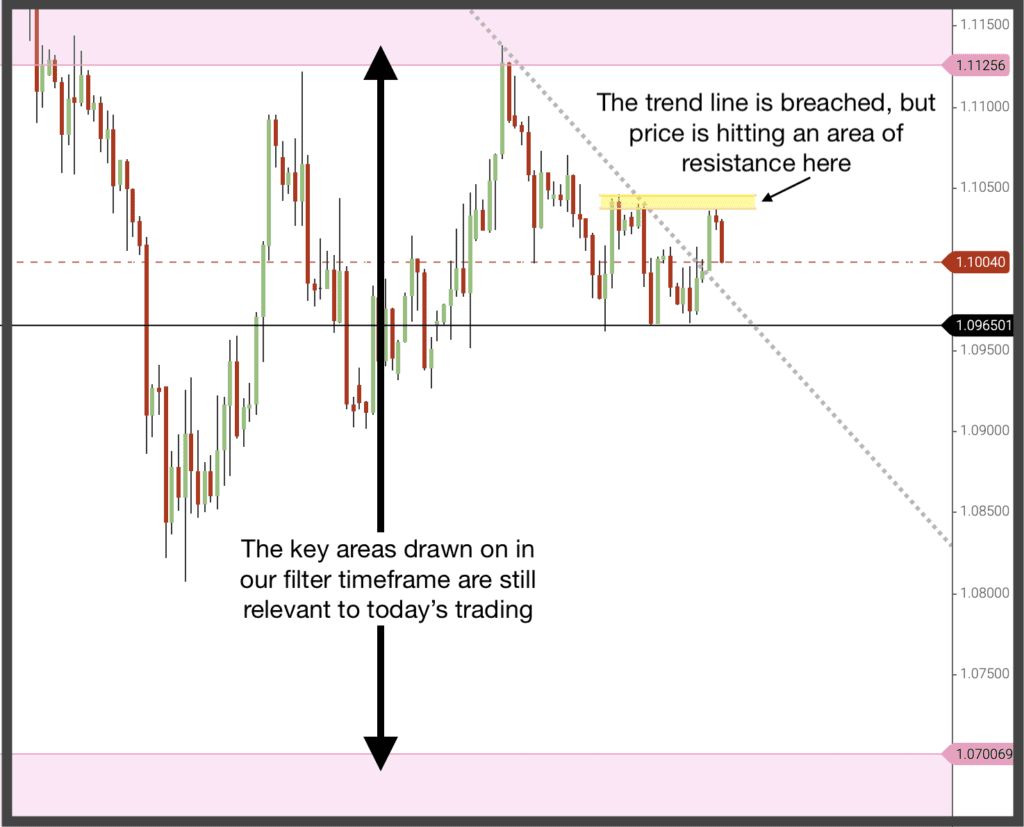
But the key areas drawn in on our longer timeframe, are still relevant and useful going forward.
Another example of the FILTER … SIGNAL … TRIGGER …
Here we are going to be trading a 30-minute USDCHF chart, so in the morning, we check the daily chart …
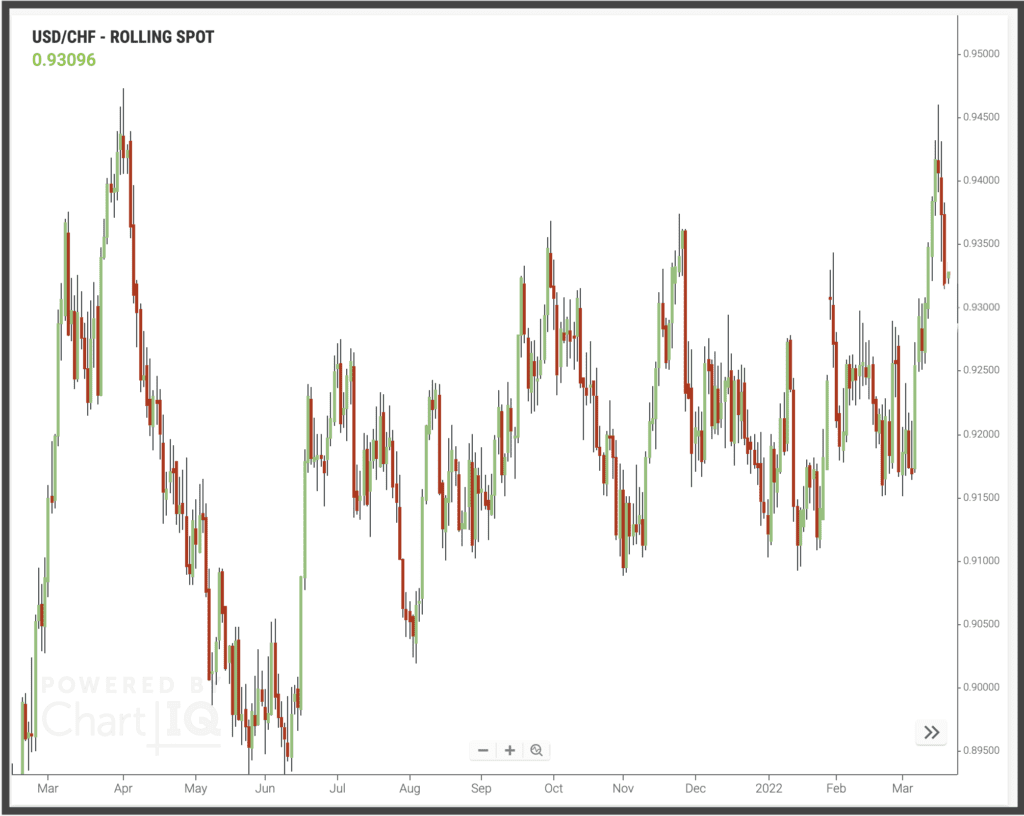
I pick up these key levels that I feel are relevant to today’s trading …
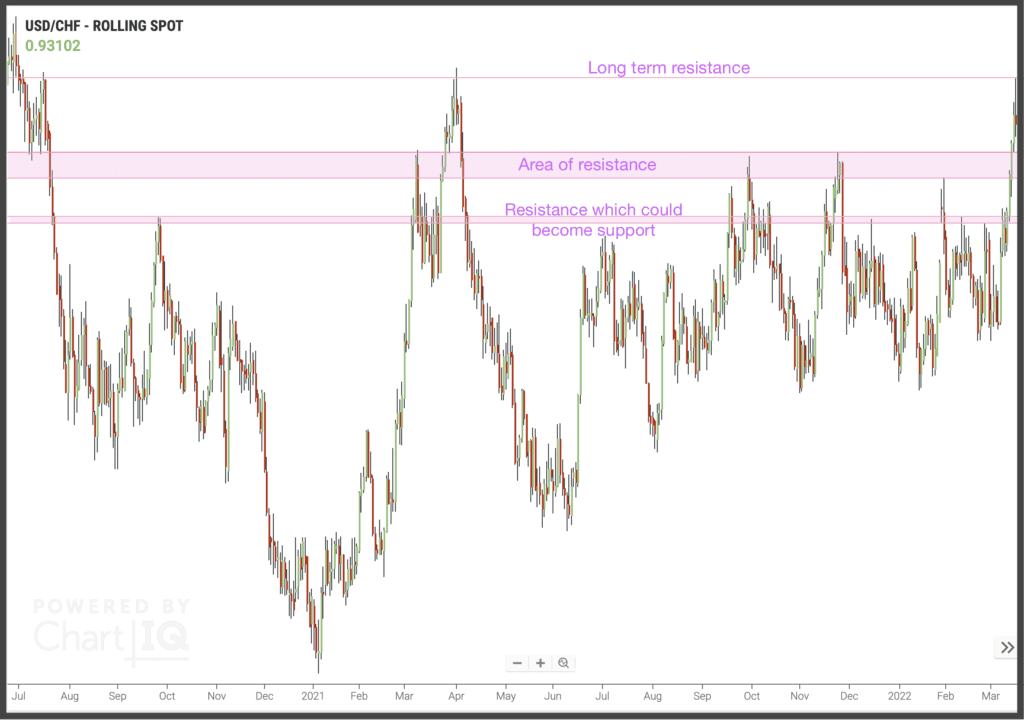
Then we zoom into our signal timeframe of 30 mins …

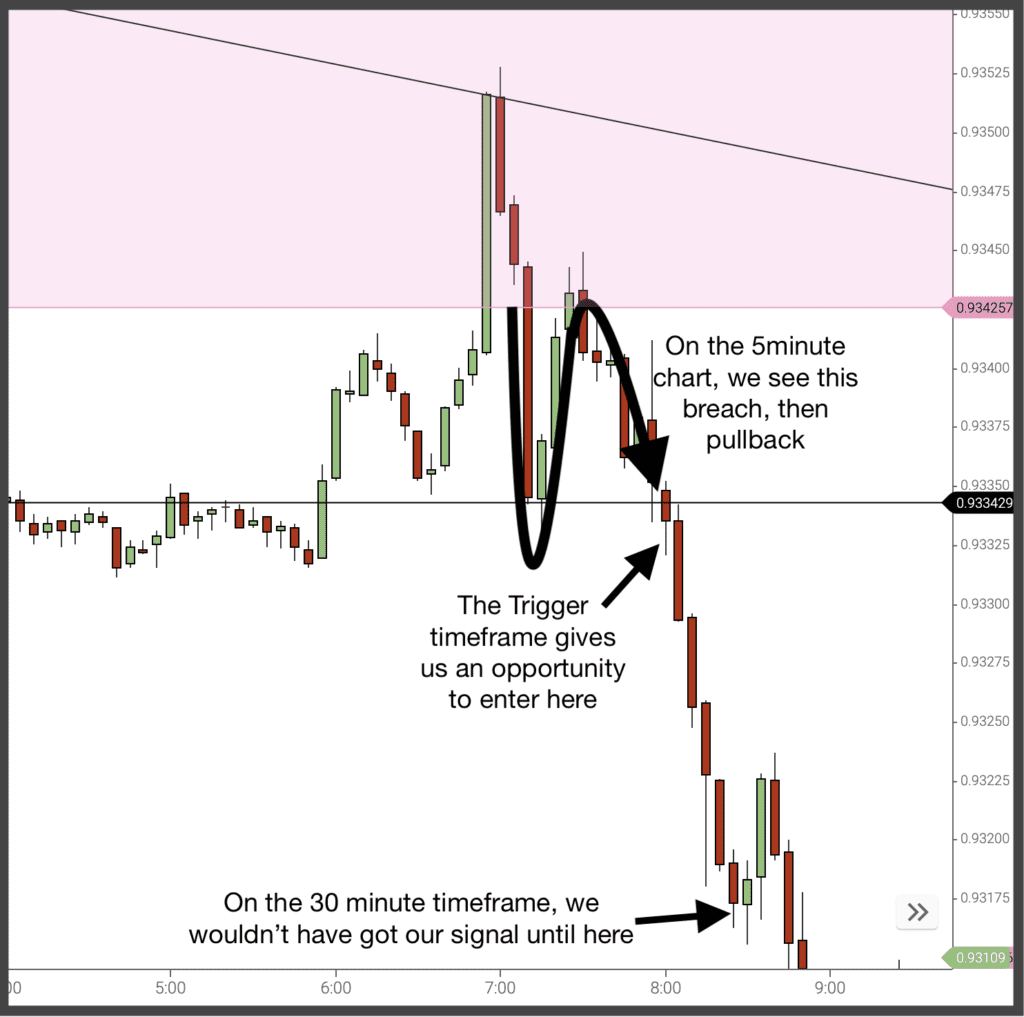
We’re looking for a move lower towards the next key levels, as the price moves below 0.9333.
So, rather than wait for the trigger on the signal timeframe, we’ll zoom in again, to a 5 minute chart …
Bringing it together
It may look complex to run through all these steps, but I want to stress that this can simplify rather than add to your trading work.
Bear in mind that the filter stage of looking at a longer timeframe is a once-a-day or once-a-week event. Those levels you draw on at that point, can stay in place and guide you in your trading over the course of the next day or week.
You’ll find that you spend less time scrolling in and out on your charts, because you already have that information displayed.
The lion’s share of your trading is still spent in the timeframe you’re most comfortable with. While zooming into the trigger timeframe can save you on those pained minutes spent waiting for candlesticks to close! (As well as getting you better entry prices.)

By adding in the filter, we increase the chance of a successful trade … and the trigger gives us a faster entry for bigger rewards and tighter risk. And – ultimately – successful trading comes down to winning bigger … and winning more often.
To enjoy more content and get it faster Follow @TradersBulletin
Related posts:


JOIN US ...
Get full access to members-only resources, plus my weekly email updates ...
I will NEVER share your details for marketing purposes. Privacy policy
Strategies I'm Using
 It has taken 2 years to persuade this market…
- These videos show how to make 24% gains in…
 As you can see from all the data I've…
 Get the low down on the Heikin Ashi Mountain…




