

My top 3 volume indicators: how to read the market’s hidden fuel gauge

Most traders focus on price, and for good reason.
But, when the game we’re engaged in is about planning for where price goes next, it’s important to understand a bit about how we got here.
And that’s why volume matters.
Volume can help us see whether a price move is supported by serious market participation, or whether everyone’s looking the other way and price is just drifting.
A price move on low volume can be turned easily. But a price move with strong volume suggests commitment and possibly institutional interest – that can be more like trying to stop a tanker that’s just got a green light through the Strait of Hormuz.
There are a number of ways to look at volume within a price chart, and knowing how to read these indicators will help you avoid getting fooled by weak moves.
What is volume
Volume is trading activity during a specific period. A higher reading suggests that (depending on the market) more contracts, shares, lots or units changed hands, while a lower reading means less participation.
Volume does not give us any information about who’s winning or losing, or about direction (the price tells us about whether the buyers or sellers got the upper hand).
Note that on many markets, your broker’s volume indicators aren’t showing real traded volume, but ‘tick volume’ – this is how many times the price updates during that period.
Why care about volume?
Volume matters because a strong move with high volume suggests that players are behind that move. A big move with low volume, however, would suggest a thin market with weak participation that may be vulnerable to failure.
- Volume can confirm our entries
If price breaks a major level and volume increases, that breakout will carry more weight than one on dwindling volume, which suggests exhaustion or trapped traders.
- Volume gives clues about participation
Big volume suggests more participants and hints at institutional activity.
- Volume acts like a heat map on our charts
High volume areas act like magnets for future price behaviour, while declining volume can warn us that a move is losing momentum.
The most familiar way to view volume is with a standard volume chart, which usually runs underneath price.
Standard volume indicator
A standard volume chart tells us volume levels during specific time periods. On a candlestick chart, you’ll see volume bars aligning to each candle. So, on the 5-minute chart shown below for the US500, we can clearly see the volume reading for each 5-minute block of time, showing how volume surged as around the US open and close times.
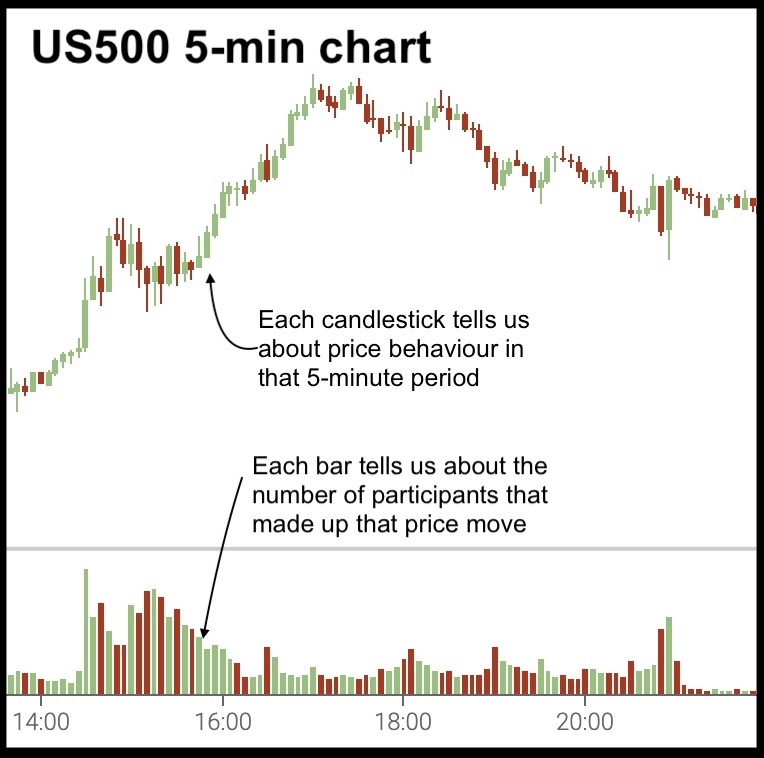
Standard volume charts are easy to read, fitting naturally in with the way we’re used to using our charts to view blocks of time. However, they don’t tell us what price level the volume occurred at. When there’s a big move with high volume – it’s impossible to know whether the activity surged at the top or bottom of that price range.
Knowing that big market players all jumped in at 2.30pm isn’t actually very useful. I want to know what price point they jumped at.
Which is where the volume profile comes in …
Volume profile
The volume profile indicator looks a little different. It’s usually displayed as a horizontal scale along the side of the chart.
Rather than showing the volume of activity at a time, it is showing the volume of activity at each price point.
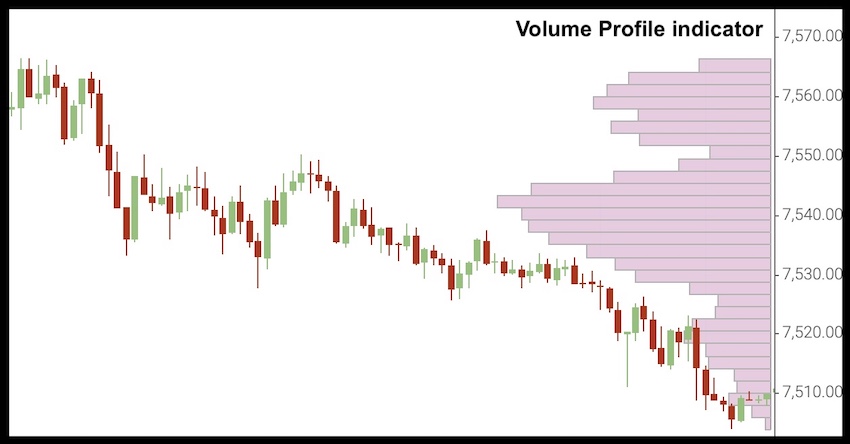
This helps us to identify areas where the market has heavily traded – these zones can be future price magnets.
This can be much more helpful when we’re considering entry zones, and positioning stops and targets. However, bear in mind that the volume profile relates to the selected lookback range – as you zoom in and out or scroll through the chart, your volume profile will change, and it can get confusing if price has revisited areas.
How to combine the two for optimum readings
The standard volume chart is useful for big-picture thinking and getting a ‘feel’ for market sentiment … is this breakout supported by a spike in activity …? … Is participation fading on this trend …?
While the volume profile is better when I’m zoomed in looking for key levels and zones – where should I be looking to enter? … Where should I take profits? … What should I avoid for my stop level?
Standard volume is about timing. Volume profile is about location. Neither is better than the other – it just comes down to which piece of information is more useful to you in this instance?
But what do you do if both of these indicators are making your head spin? You want to use volume in your trading, but you want it spelled out in simplest terms because – let’s face it – you’ve got enough other information to be balancing!
The answer is here …
Market Facilitation Index
The Market Facilitation Index, often shortened to MFI, was developed by Bill Williams. It compares price movement with volume to show what I think is best described as a ‘willingness’ of the market to move the price.
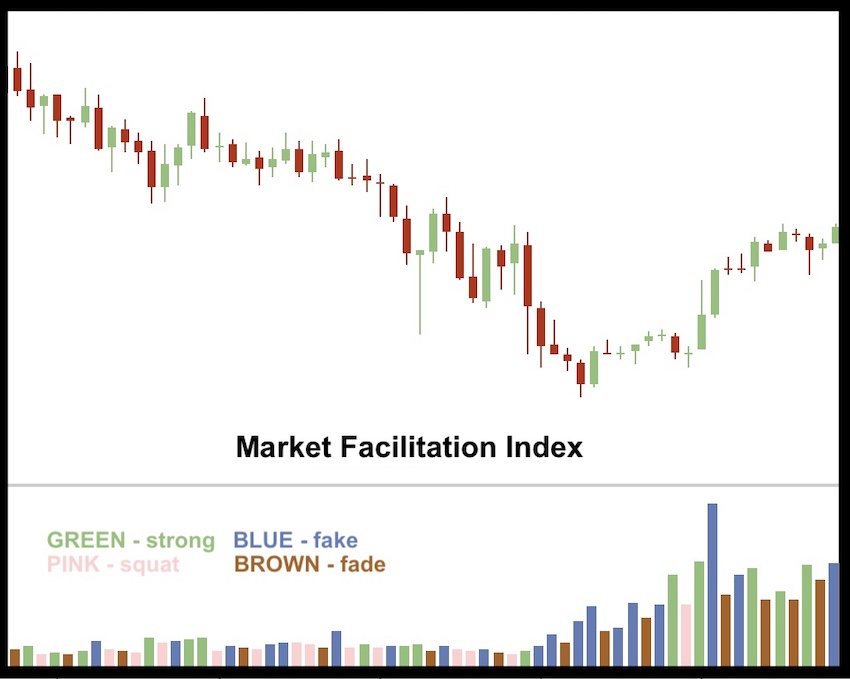
The core idea is that MFI measures the range of the candle relative to the volume and comes up with four categories, according to the size of the move and the scale of the volume:
- Green bar
Both MFI and volume are building. This suggests the market is moving strongly with growing participation. This can be seen as confirmation of an entry signal.
- Brown (fade) bar
This ‘fade state’ comes when we have a small move and low volume. It signals traders losing interest, perhaps a trend ending and time to exit. If we get a run of brown bars, it’s often regarded as a pause ahead of a new move.
- Blue (fake) bar
Here we have movement but no volume. This is a warning that the price move is unreliable as price is moving, but without participation. The ‘fake state’ can be trying to tell us that a move is unreliable, like a fakeout.
- Pink (squat) bar
The ‘squat’ state is the coiled spring of your chart. It signals strong volume levels, with little movement – buyers and sellers are battling it out, and this could be a springboard for a big move.
Volume indicators – for sentiment, not signal
Which volume indicator you use, depends on the question you want answering. Each contains powerful information that can really impact your trading success.
Volume matters in trading, but it’s important to note that volume readings are not signals. These give us context behind the price movements.
So, whether you prefer the simplicity of a standard volume chart, the price-level detail of volume profile, or the traffic-light style of the Market Facilitation Index, the key is to remember what volume is really giving you. It is not telling you what will happen next. It is helping you judge the quality of what is happening now. Price shows the move. Volume helps you decide whether that move looks supported, stretched, crowded, weak, or worth taking seriously. And in trading, that extra layer of context can make all the difference.


JOIN US ...
Get full access to members-only resources, plus my weekly email updates ...
I will NEVER share your details for marketing purposes. Privacy policy
Strategies I'm Using
 It has taken 2 years to persuade this market…
- These videos show how to make 24% gains in…
 As you can see from all the data I've…
 Get the low down on the Heikin Ashi Mountain…





4 comments
Ray Vuu
Mark, thank you. well presented and thoroughly made to be understood.
well done.
Traders Bulletin
Thanks for the feedback Ray. Glad you found this useful
Mark
Thanks for your comment Hugh. Volume indicators on a spread-bet platform will be based on tick data, as we are removed from real traded volume. I checked with Trade Nation on this, and will post their response below:
The volume indicators on our web-based platform are based on tick data from the underlying market that the instrument is derived from. Specifically, volume represents the number of price ticks (price updates) used to form each candle, rather than executed client trades on our platform.
These tick updates are provided by our liquidity providers and reflect activity in the broader underlying market. As such, periods of higher market activity result in more frequent price updates, which increases the reported volume.
This approach is consistent across all instruments on the platform, as all charts are derived from underlying market data feeds rather than internal trade execution volume.
Hugh Coster
How do we know whether we are being shown tick volume or real traded volume?