These tools will show you where to put smart stops, which are less likely to be hit, but will work extra hard to cut risk.
These are the key to achieving the ultimate goal of locking in profits so you can enjoy risk-free trading!
What stops are for?
What do you want from your stop level? Why do we have them?
Traders have a love-hate relationship with stop levels. We feel uncomfortable if they’re wide, but when they’re tight and get hit more often, we begrudge them. We hate our stops being hit … but if they never get hit, they wouldn’t be doing their job properly.
So, it helps to pin down what the job of a stop level
is …
It needs to protect us from disaster – i.e. to get us out of a trade when a market drops dramatically.
But we want a lot more than that from our stops …
I want my stop to cut losses if the signal I entered on turns out to be false.
I want it to NOT bump me out of trades when there’s normal levels of volatility in the market I’m trading.
I want it to work hard to keep my risk levels low when compared to my reward levels.
It’s a lot to ask for.
So, let’s look at some candidates for this highly
demanding job description …
Donchian Channel
This is a very simple but highly effective indicator that was a favourite with the famous Turtle traders.
This indicator is especially useful for anyone who
wants to use support and resistance levels to position their stops, but doesn’t
have the confidence (or inclination) to look back at charts and draw in lines.
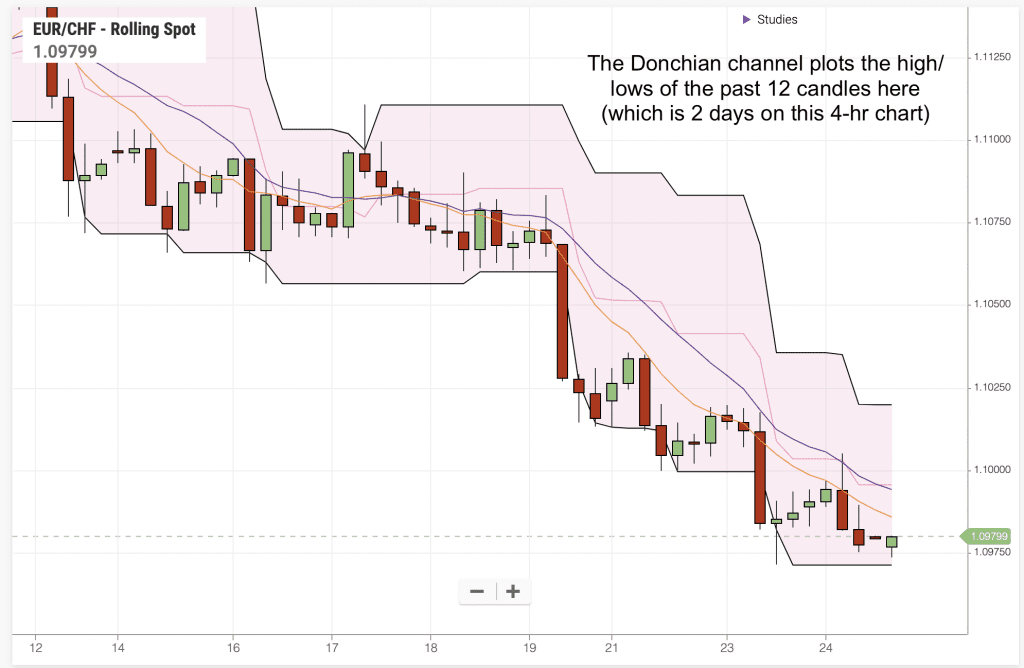
The Donchian channel does nothing more than mark the recent high and low over ‘x’ number of candlesticks. Here’s an example …
When deciding what period to look back over, think about what timeframe you’re using. In the example above, by using 12 candles over a 4hourly chart, we’re looking back over 2 days. But if you were trading an hourly chart and wanted the daily high and lows, you’d set the Donchian channel to 24 (assuming you’re trading a 24 hour market – many aren’t, so check this).
Donchian levels can make excellent intial stops, and
can also be used as trailing stops, following behind the price action, reducing
risk and locking in profits.
Donchian levels are most powerful if you’re entering
an established trend. However, if you’re looking at reversals, where the price
is turning from an extreme, Donchian channels can be too close to current price
action to be useful.
Parabolic SAR
The parabolic ‘stop and reverse’ system, or PSAR, is a
classic trailing stop method.
The indicator is based on the highest price reached in an uptrend or the lowest price reached in a downtrend …
Again, this works well with trend-following methods.
Keltner Channel
The Keltner channel looks a lot like Bollinger bands,
but is subtly different and more useful for trailing price levels.
It creates two bands either side of the price action
(although prices do break through the channel when trending), based on the
average true range of the price, smoothed out with the use of moving averages.
You can set the look-back period and the ‘shift’ – i.e. how many multiples of the ATR you want your level away. In this example, we have a look-back period of 30 candles, and a shift multiple of 3 …
Further tools
There are plenty of other ways to set your stop levels – like using support and resistance levels, pivot points, Fibonacci levels or the Supertrend indicator. But if you want an indicator that’ll draw a line on for you, and allow you to trail the price, the three above are favourites.
One that isn’t covered here, and warrants a post of its own is: Chandelier Exits if you fancy trying something a bit more involved.
A good way to compare these stop levels would be to
pile them all onto your charts and compare how they would have fared in getting
you out of trades in the past.
What your trailing stop can’t do
As we’ve seen above, we ask a lot of our stop levels –to help us identify the point at which our trade idea is no longer working, protect our capital and—where possible—give a successful trade enough room to keep running. They need to get us out of losing trades fast, but, when they do just that – we hate them for it.
My advice is to not rely on a trailing stop alone to get you out of a trade:
Combine it with an ambitious profit target so that you don’t always have to watch profits deplete before you get out of a trade.
And look for other signals that a setup hasn’t worked. If you can invalidate a bum trade before your stop is hit, it can save you a lot of money.
I like to think of setting stop levels as a bit like parenting … you need to be there when things don’t work out, but you don’t want to be helicoptering and jumping in too fast. And – of course – when things go wrong, you’ll be told that it’s all your fault!