

A simple momentum strategy using the Elder Impulse system
As ever, the Trader’s Bulletin moto is: why pay for something if you don’t have to?! Which is why I want to show you this is a great trading system. Here’s why I love it …
- It comes with its own intuitive candles – specially colored to tell you when it’s a signal, so any fool (i.e. me) can read them …
- The clever candles take into account both trend and momentum (that’s the important work done for us)
- And, I’ve just discovered that it’s available with one click on your trading platform!
What’s not to love?
So, let’s see how it works …
The Elder Impulse trading system has been around a few years, developed by Alexander Elder. It uses special price bars which instantly tell you by their colour whether the market is bullish or bearish.
When I realized that these price bars were available on my broker’s platform, I thought I should tell you about them, and how to put them to some great use in your trading.
The lovely thing about Elder’s price bars is that they combine two really important factors for getting into a trade – trend and momentum. It’s looking at both the 13-bar exponential moving average and the MACD– measuring the angle of the moving average and the relative sizes of the histogram bars. In my view, these are two really smart indicators. If these two factors are agreement – we get a signal.
Here’s what Elder says about his system: “The Impulse System encourages you to enter cautiously but exit fast. This is the professional approach to trading, the total opposite of the amateur’s style. Beginners jump into trades without thinking too much and take forever to get out, hoping and waiting for the market to turn their way.”
I couldn’t agree more. So, here’s what the bars look like on your chart …
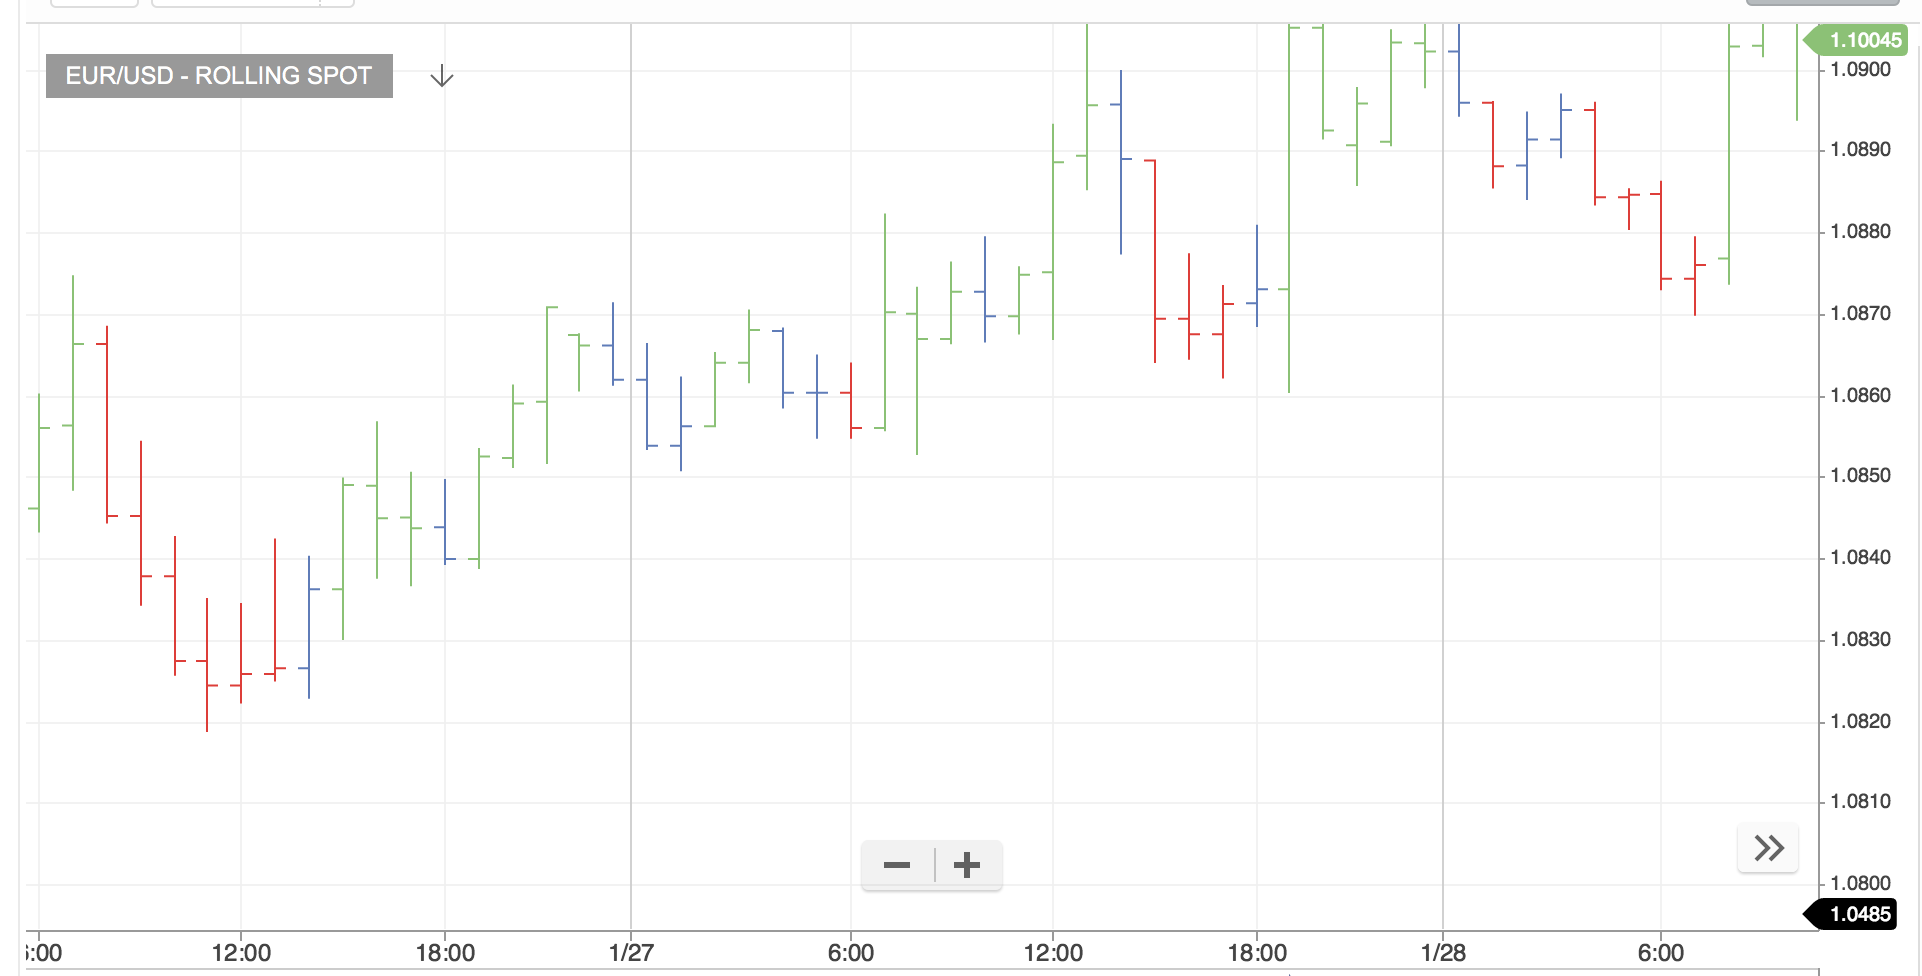
The green ones are buy signals; the red ones sell signals.
But there’s another factor to take into account – we have to trade with the longer-term trend. Elder recommends the current timeframe multiplied up by 5. So, if you’re trading a daily chart, you could look at the trend on a weekly chart. Alternatively, you can just multiply up your 13EMA by 5, to give us a 65EMA on our chart – this will show the longer-term trend.

Bear in mind that the 65-bar EMA is on there to show us the longer term trend, so a nudge above this level isn’t enough for a signal – it needs to be a clear, significant breach.
As I said earlier, this system is about getting out quickly. It’s trading momentum, so if that momentum fades, we get out. We don’t wait for a sell signal to get out of a buy trade, or a buy signal to get out of a sell trade. We’ll jump ship as soon as there’s a blue price bar.
Here’s an example on an hourly of how trades could look …

Note, I’ve waited until a full candle (of the right colour) has opened and closed above or below the 65EMA before it’s a signal to buy or sell. I’m then entering at the start of the next candle. I’d expect to see quite a few trades resulting in small losses or breakeven, as we’re waiting for the big momentum moves, where we can catch the swings, and take profits on the pullbacks.
A sensible place for stops would be behind a recent high or low – we’re getting out fast if momentum dips, so there’s no need for really wide stops.

As with any trend-following system, it’ll do better when the markets aren’t chopping about, so it might be possible to add an extra trade filter in there, like an ADX level that you want to be above before entering a trend.
In theory, the Elder Impulse system can work on any timeframe, but longer timeframes will allow you to catch those nice big moves, and not get stung with costs on numerous small losses and breakeven trades.
I look forward to hearing how you get on with it (please leave your comments below) …
To enjoy more content and get it faster Follow @TradersBulletin

JOIN US ...
Get full access to members-only resources, plus my weekly email updates ...
I will NEVER share your details for marketing purposes. Privacy policy
Strategies I'm Using
 It has taken 2 years to persuade this market…
- These videos show how to make 24% gains in…
 As you can see from all the data I've…
 Get the low down on the Heikin Ashi Mountain…





37 comments
Oliver Nielsen
There’s an inaccuracy here. A fatal flaw with the premise.
The Elder Impulse System tells you when you’re NOT allowed to trade!
So “green bar” on either (!) daily or weekly charts (if swing trading – else use two other suitable timeframes) means “you’re NOT allowed to SELL”.
Conversely. red means “you’re NOT allowed to BUY”.
It’s a censoring system. Helps you to not enter trades too early, and to not exit too early, either.
PrafulMD
Hi Mark,
This is very helpful.
Can you please suggest the range of EMA if I am looking at 3 or 5 min candles?
Thank you.
Mark Rose
Hi, I’m pleased you find this useful. If you’re looking on shorter timeframes, you can still use the 65-period EMA. I’d be really interested to hear how you get on with shorter timeframes – I’ve noted a few people have been exploring this, but haven’t had any feedback. Best of luck with it.
Roy.
Mark.
Afraid my routine is based on the old ‘snakes and ladders’ game.
I use the 10 SMA, and the Stoc Momentum indicator, which is a dream.
Usually 5 min frames, with a look either way.
Trade through set ups would be a bonus, but otherwise a really nice bit of kit.
Roy.
B R Subramani
Hi Mark,
Thanks heaps for detailing about Elder Impulse System.
I am from India a day trader in Equities. I used to do my daily trade with Pivot ( Fibonacci) Table along with 65 EMA on a day Candle Stick Chart (10Minutes) along with MACD Histogram.
I started using Elder Impulse System along with my regular Pivot ( Fibonacci) Table, 65 EMA and MACD Histogram from Monday, February 08 after completely understanding the System. It is almost seven days now and I found it very useful and my successful trades rate increased from 60 to 80%.
I am learning a lot and understanding more and more of the system every day and confident that I will able to achieve 100% successful trades in a month.
looking forward to hear from you about more and more trading systems and tools in the coming days.
Regards,
Subra
Mark Rose
Great to hear that it’s helping to improve your success rate. 100% might be a bit hopeful – but always worth striving for perfection! Look forward to hearing more of your progress.
Carlos
Hi Subra,
I’m sure that many people would like to know if you achieved the 100% successful trades. Is that possible? I believe not but would like to know your opinion.
Regards
Carlos
Darin
I’ve been looking into this fairly carefully. I’ve backtested several pairs for 2015, daily chart only. These were Euro, Cad, Aud, Nzd, so far. I’ll do more as time allows. Strictly following your rules Mark they did ok though not brilliantly, the Aud & Cad were great, Euro & Nzd less so, though still made money. I realise hindsight trading is easy and trading decisions may well be different in real time. Its laborious work but the only way as far as I’m concerned before committing real money. Also gives a good ‘feel’ for how it works.
It became clear while testing things that some extra filters were needed to avoid getting into numerous trades that go nowhere. I’d definitely check daily AND weekly chart for bar colour &type, ie extension, indecision etc, and, crucially where price is in price cycle ie Phase 1 (swing) Phase 2 (pullback), possible return to 65ema/Trendline. In fact I’d check this before noting bar colour etc. Oh, and ranging/choppy markets are no good at all. Check of charts shows this. Be patient and wait for trend.
Also looked at several of Elders’ presentations on YouTube. Interestingly he describes this as a ‘censorship system’ not a trend following system and I note it is titled as a Momentum strategy.
Ok, that’s my 10c worth. I’m no expert here, just noting what I’ve observed so far. I’d be really interested in seeing results from others, so be brave and put them up-Thanking you in anticipation. Eg, what pairs, pips made etc.
Mark Rose
Hi Darin, thanks for the feedback – really interesting stuff. I like the idea of getting in on a pullback. Also would be interested to hear more about the idea of a ‘censorship system’ – do you have the link to this video? Cheers, Mark
Darin
Hi Mark. Here’s the link
http://www.youtube.com/watch?v=kJQs7aDXJgw
or search ‘Trading for a Living’ Dr. Alex Elder
His comments about the system are scattered throughout several of his videos, In this one go to the 29.44 min point where he talks about the system for several minutes.I suspect there would be more info on his website.
re censorshp system- Essentially he seems to be saying that green bars mean don’t go short and vice versa.
david
Should work,but impossible to use for short timeframes (5min) as Corespreads platform not usable.
Mark Rose
Hi David,
I’m tending towards the longer timeframes for Elder, but it would be nice to be able to test on 5mins charts.
Regards,
Mark
Paul
Hi Mark,Do you only buy when the green bars are above the 65 EMA,and sell only when they are red i.e below,or can you buy if the green bars come after the blue bars irrespective of where they are in relation to the 65EMA,the same with the red bars, do they have to be below the 65EMA.
Mark Rose
Hi Paul, yes, that’s right – only buy on a new green bar above the 65EMA, and only sell on a new red bar below the 65EMA
Laurie
Thanks a lot for the heads up on this Mark 🙂
I’ve opened a demo account and opened a DAX trade on the DAILY chart. The bars were red and still are, but the price has spiked against me by 60 odd points just now. Is it wrong to place a trade DURING the red bars sequence? Should the trade only be opened if the price has gone from blue to red? I was probably too impulsive with this and should have gone for something else?
Mark Rose
Hi Laurie, I think you’ve answered your own question. While it’s tempting to get in when you see those red bars, it’s worth waiting for a new red bar (i.e. changed from blue to red, or green to red) – that way you’re getting in with a burst of momentum behind you. That’s not to say that you won’t still experience a 60-point spike against you. The average daily range on the DAX is over 200, so if you’re trading the daily chart you’ll need to be able to stomach these swings. Best of luck!
Laurie
Thanks Mark – must try harder! I’ll be more patient next time 🙂
Liam
& which pairs?
Mark Rose
Hi Liam, I’d recommend looking at longer timeframes, like daily charts. I don’t have any data on which pairs this is working best on. Be interested to hear what people are finding?
Liam
What time period are people finding the most effective?
patricia cheek
What a lovely surprise. You can’t help but make a profit if you use this the right way. It certainly has made an impact on my trading and has certainly given me more confidence in my trading. Thanks Mark for pointing this out.
Mark Rose
Really pleased to hear that you’re having success with it – don’t forget to come back to this page to let me know your progress. Cheers, Mark
Roy
Many thanks Mark.
I do like simple things, and this is right up my strasse.
I funded Corespreads this morning, having left them some months ago.
Their original site was excellent but just seemed to be stuck in glue, whereas the present version is perfect.
This Elder job is a gem.
Roy.
Mark Rose
Hi Roy, I’m pleased with the new Core Spreads platform too. And these Elder charts are an extra bonus!
Mark Rose
Hi Brian, pleased to hear you’ve made a positive start – keep us posted.
Brian Farrow
I started the strategy yesterday and so far have made some profitable trades.
I like the simplicity of the strategy and well defined buy and sell signals.
Mark Rose
Dave, Darin – look forward to hearing your progress. Really good news from Core Spreads is that they’ve dropped the duff Saturday candles from their daily charts, which I suspect were messing with the longer term data on indicators like these.
Darin
Thanks for this Mark. I looked at this indicator a few months ago and thought there was something wrong with the display on the screen! (what the hell are those blue bars doing there!!!). I been having a think about it and I’m going to give this one a good run and report monthly starting from March on here as I did with Pivot Trader.
The thing I really like about it is those little blue bars that shout GET OUT NOW! Oh yeah, I love that idea because leaving trades to run for too long has cost me quite a bit of money over the last couple of years. I’ll see how I get on. 🙂
Dave
Thanks mark, I’ll try this on a demo first for all my forex trades on the 4hr/daily as it’s just a quick visual set up.
Paul H
Nice system ! I would not have taken the first trade which failed because it was not the first green bar after the blue or red bars. I would only enter on the change of bar colour i.e. after the first red bar below the 65 SMA or the first green bar above the 65 SMA
Mark Rose
Hi Paul, sounds sensible – that way you should be able to get in after any pullbacks once the trend is established. Let me know how you get on
Mark Rose
Thanks for the feedback – I look forward to hearing how you get on with it …
Sanchit
Hi Mark, Have you tried any other settings for EI like instead on 12,26,9 on MACD and 13EMA. May be some other numbers?
Traders Bulletin
Hi Sanchit, no I don’t have any data on this – always worth exploring new options. Be interested to hear how you get on.
PrafulMD
Hi Mark,
This is very helpful.
Can you please suggest the range of EMA if I am looking at 3 or 5 min candles?
Thank you.
Simon
Nice little system. Thanks Mark
Mike
Another great tip. There’s so much out there available for free, it’s just tough knowing where to look, and what’s worth using – thanks for the pointer Mark