

My 4 best momentum indicators

Deprecated: trim(): Passing null to parameter #1 ($string) of type string is deprecated in /home/sites/6b/8/8b98caeda7/public_html/newwp/wp-includes/link-template.php on line 3932
Trading with momentum is a great thing – momentum is the force that drives prices neatly to their profit targets.
But there’s a huge arsenal of tools, so how do we know which are the right momentum indicators to use?
There are momentum indicators that measure the price relative to the previous close … the price relative to the range … the price relative to the moving average … relative to the range …
What’s the best one?
Here I’ll show you my top 4 momentum indicators, along with tips on how to apply each. PLUS, if you fill in your address below, I’ll send you my simple FREE momentum strategy, which uses a very clever trick to help visualise momentum moves at a glance.
Claim your FREE momentum system
This includes a free subscription to my Trader's Bulletin weekly newsletter. You can unsubscribe at any time. I will NEVER share your details for marketing purposes.
Before I get into my favourite momentum indicators, here’s a quick briefing on oscillators, and what goes wrong with them (so we won’t be making this basic momentum error) …
The overbought/oversold market pendulum – and the wrong way to use momentum indicators
If you’re familiar with a momentum indicator, you’re probably thinking of an oscillator – a line on your chart that wavers between two points. If the line is above the centre line, it implies that there’s momentum building in an upward direction … if it’s below it’s centre line, it implies there’s momentum building in a downward direction.
But when it comes to the top of its range, the reading will be ‘overbought’; if it’s at the bottom of its range, the reading will be ‘oversold’. This is where the market is considered to have moved ‘too far, too fast’, and a correction is due.
Here is a momentum indicator showing momentum increasing, and decreasing in line with price trends, and peaking at overbought and oversold levels …

Using simple overbought/oversold readings is really blunt instrument, because as soon as a trend gets going, we can be stuck in overbought or oversold conditions …

And this is why we need to be a bit smart about choosing the right momentum tool for our trading style, and applying it correctly.
Which brings me to my top four …
1. Stochastic Oscillator
The Stochastic is a favourite oscillator for many traders, and is generally considered to be a good tool for getting into trending markets at the right moment.
Let’s look at a market in a nice trend …
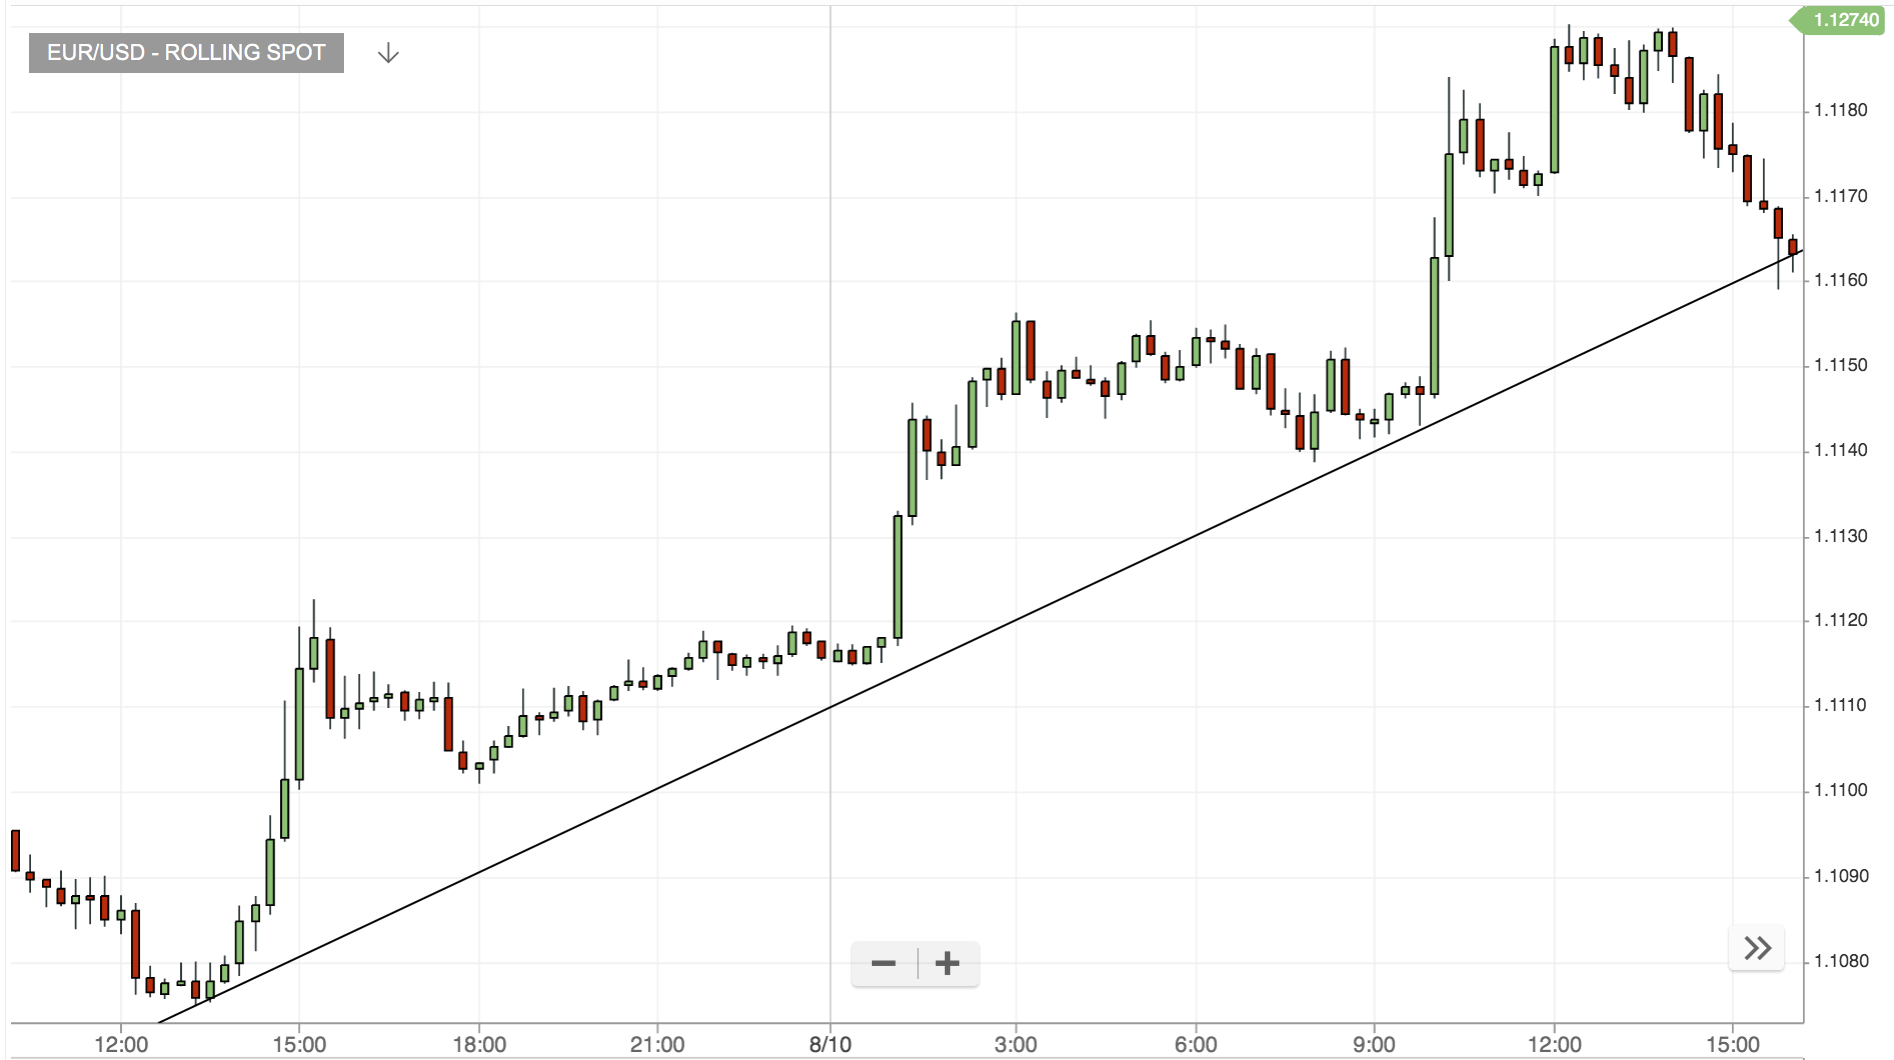
Looks like there should be some profits to be had from this trend … but have we missed the boat? How do we hop into this trend safely?
Cue the Stochastic indicator …
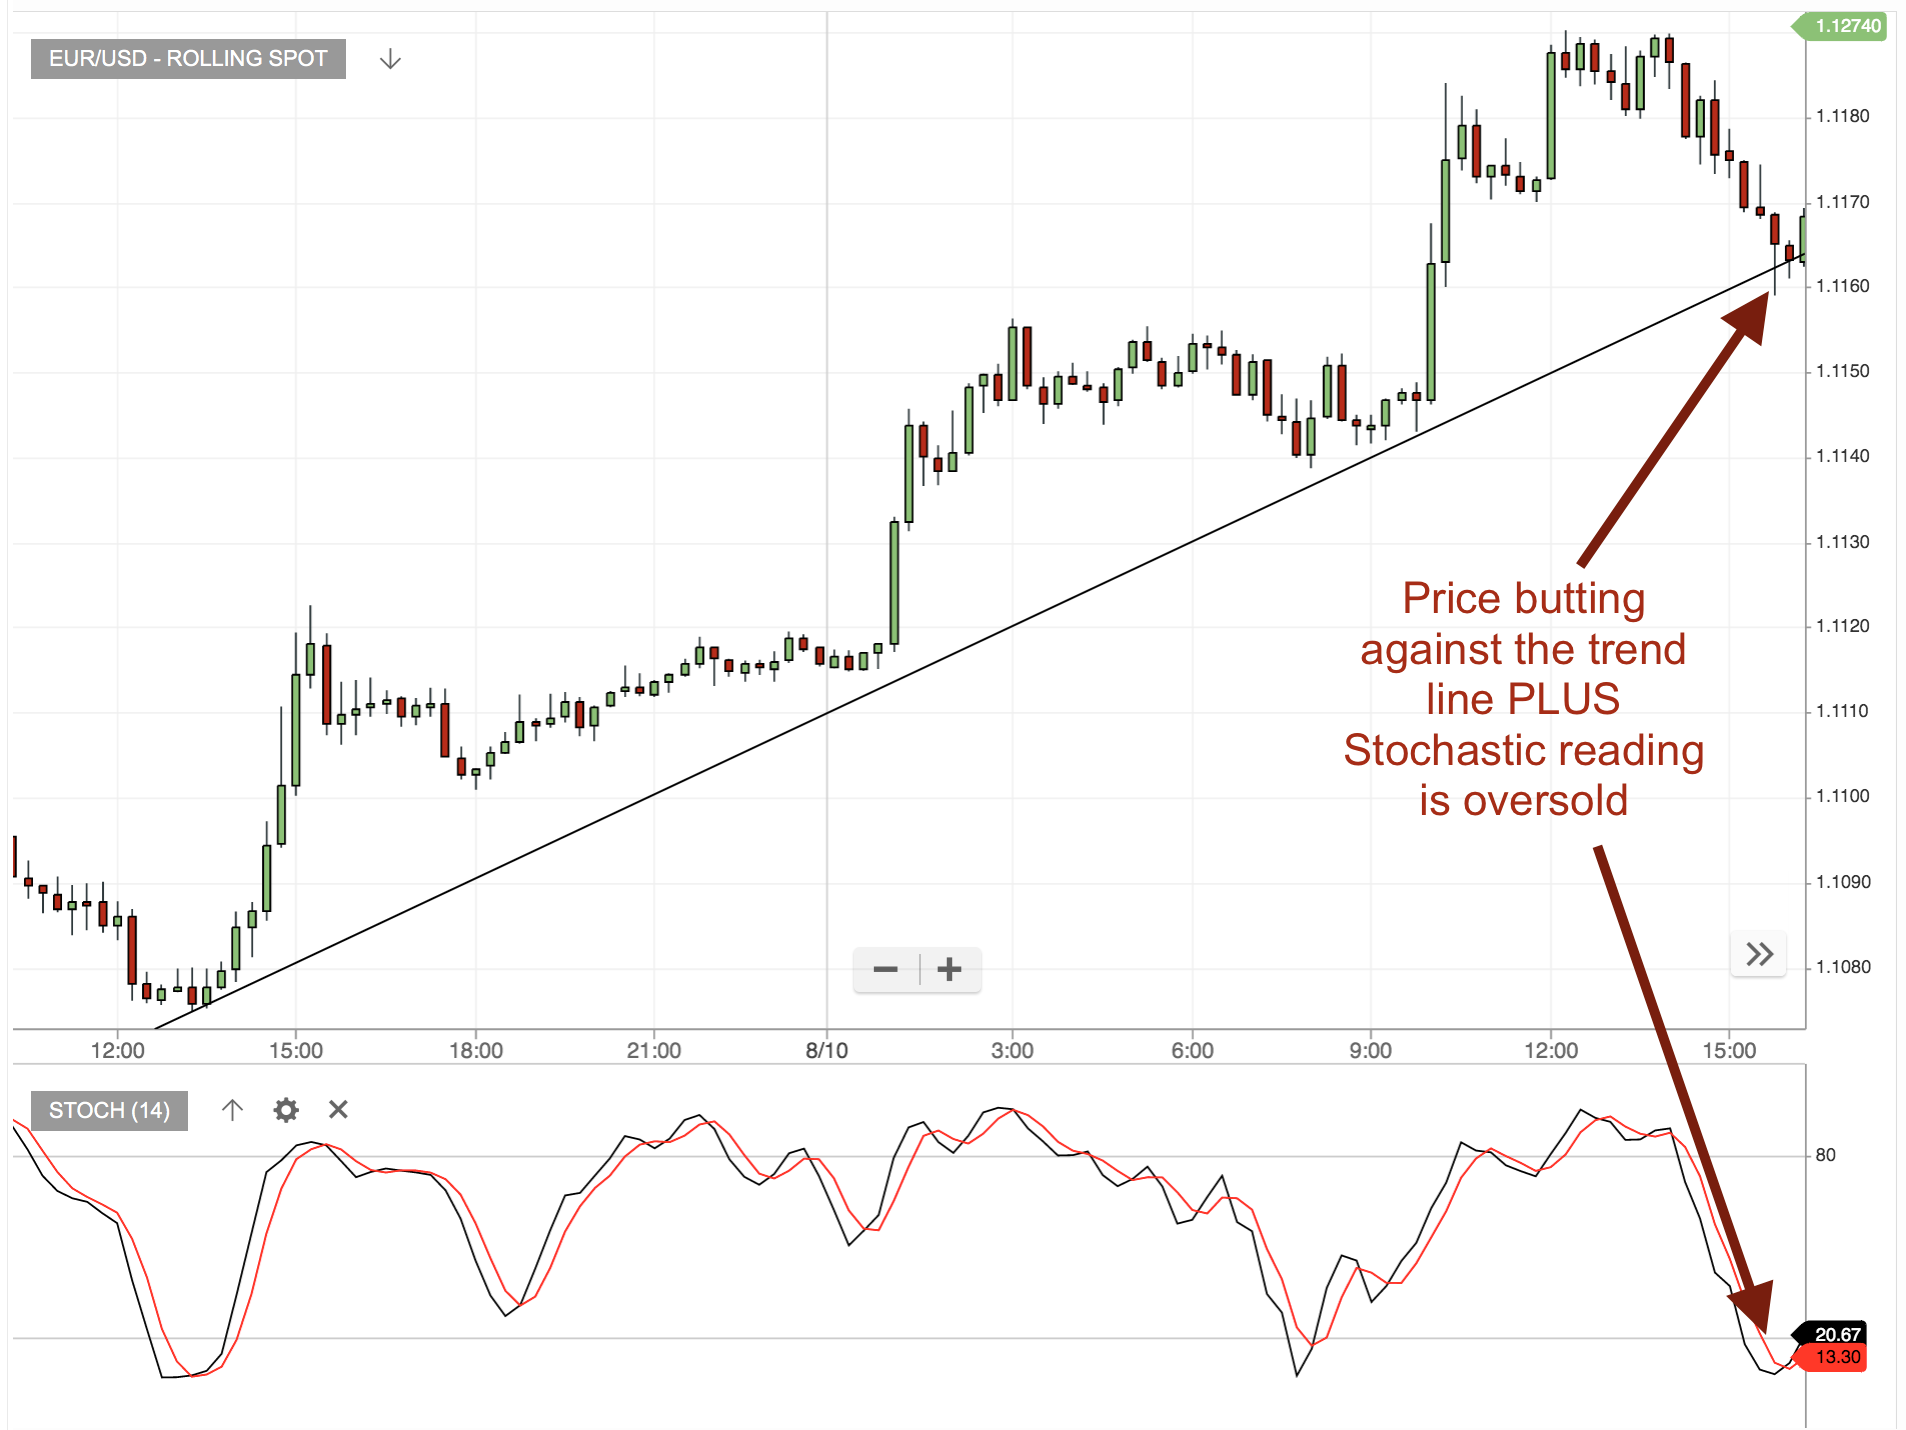
This tells us that NOW is the good moment to buy into this trend. And here’s what happens …
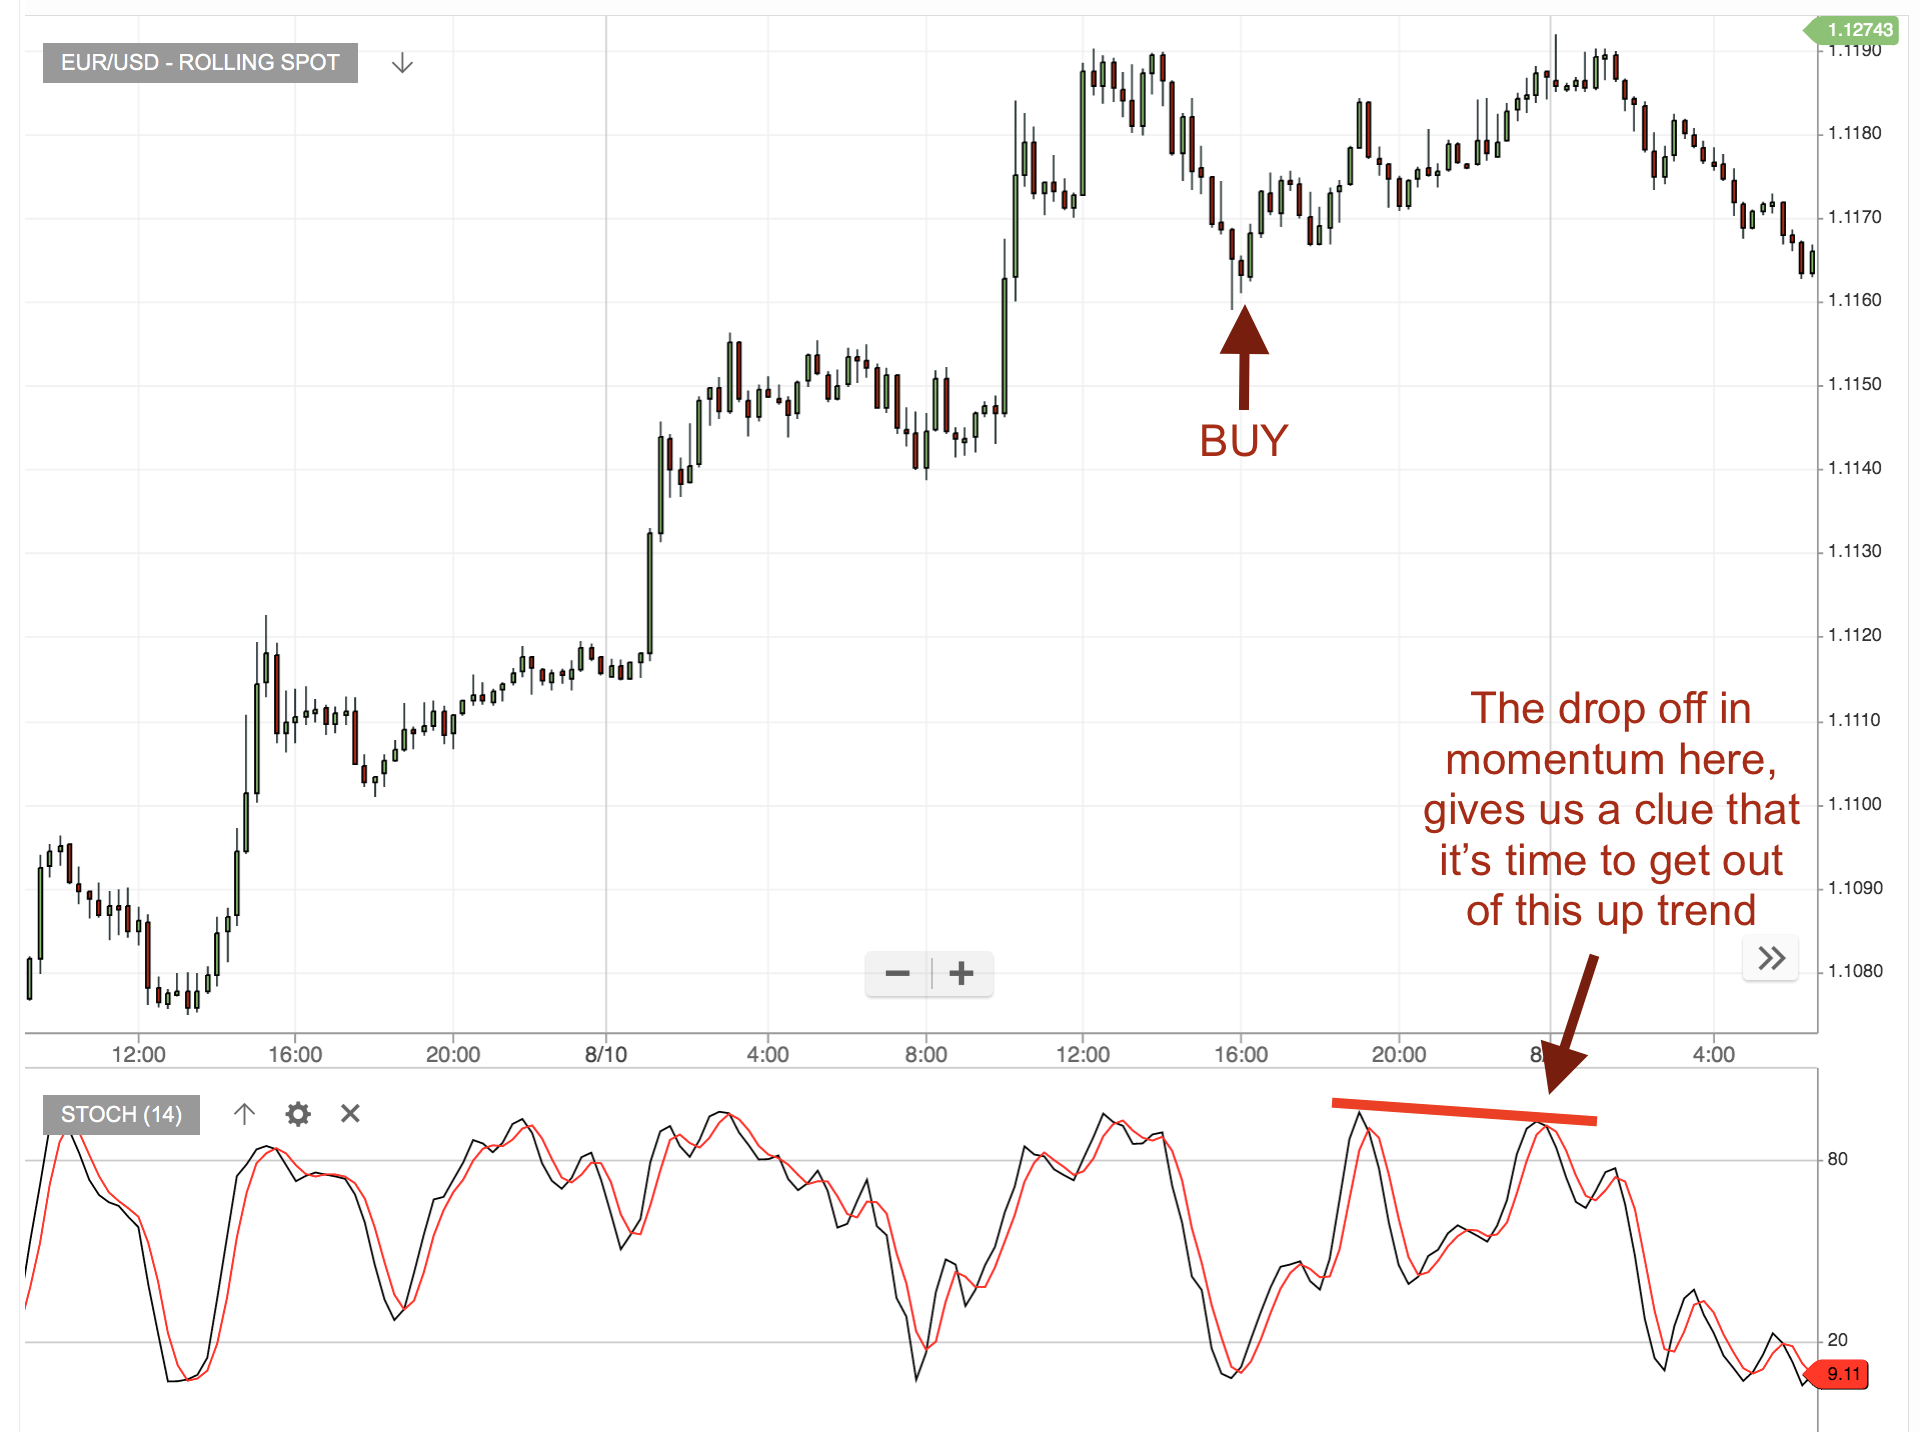
By watching the ebb and flow of momentum during a trend, you can better judge your entries and exits.
2. RSI
The RSI and Stochastics look very similar, and are often used in much the same way by traders. However, the principles behind them are surprisingly different.
The Stochastic indicator is based on closing prices – and works on the assumption that the current closing price is likely to close closer to it’s highs in an uptrend, and closer to lows in a downtrend.
In contrast, the RSI measures the speed of price movements.
There are plenty of traders who’ll argue the merits of one over the other, so here’ my two-cents worth …
For me, the RSI is more suited to finding overbought/oversold or divergence in range-bound markets, while Stochastics are better for pinpointing an entry in trending markets. There’s no hard and fast rule here – they are both great indications, with weaknesses and strengths of their own.
Here’s RSI at work in a clear trading channel … When the price butts up against resistance and we have an overbought signal, then we have an opportunity to profit from a sell trade. When the price meets resistance at the bottom of the channel, combined with an oversold signal, then we have a buying opportunity.

3. MACD
If you’ve ever used moving averages on your charts, you’ll know that sometimes they shoot off with a clear direction, and other times they meander along, failing to give you a clear indication of which way the market is moving.
It’s the frustration of the trend trader – is this trend strong enough, or going nowhere?
This is where a MACD reaches parts that a normal moving average can’t … it measures the rate that the moving average is changing – telling us just how powerful a move is.
The MACD can be used in lots of ways – the most basic being to take crossovers of the two lines as a buy or sell signal …

But I want to show you a slightly less conventional way to use this indicator … It just looks at the histogram, and will only take trades when the histogram size is large enough to indicate clear momentum in a given direction.
To do this, I draw a channel on the histogram, and will buy if the histogram breaks this channel to the upside (taking profits when it comes back within the channel); and I’ll sell when the histogram breaks the channel to the downside (again, taking profits when it comes back within the channel) …
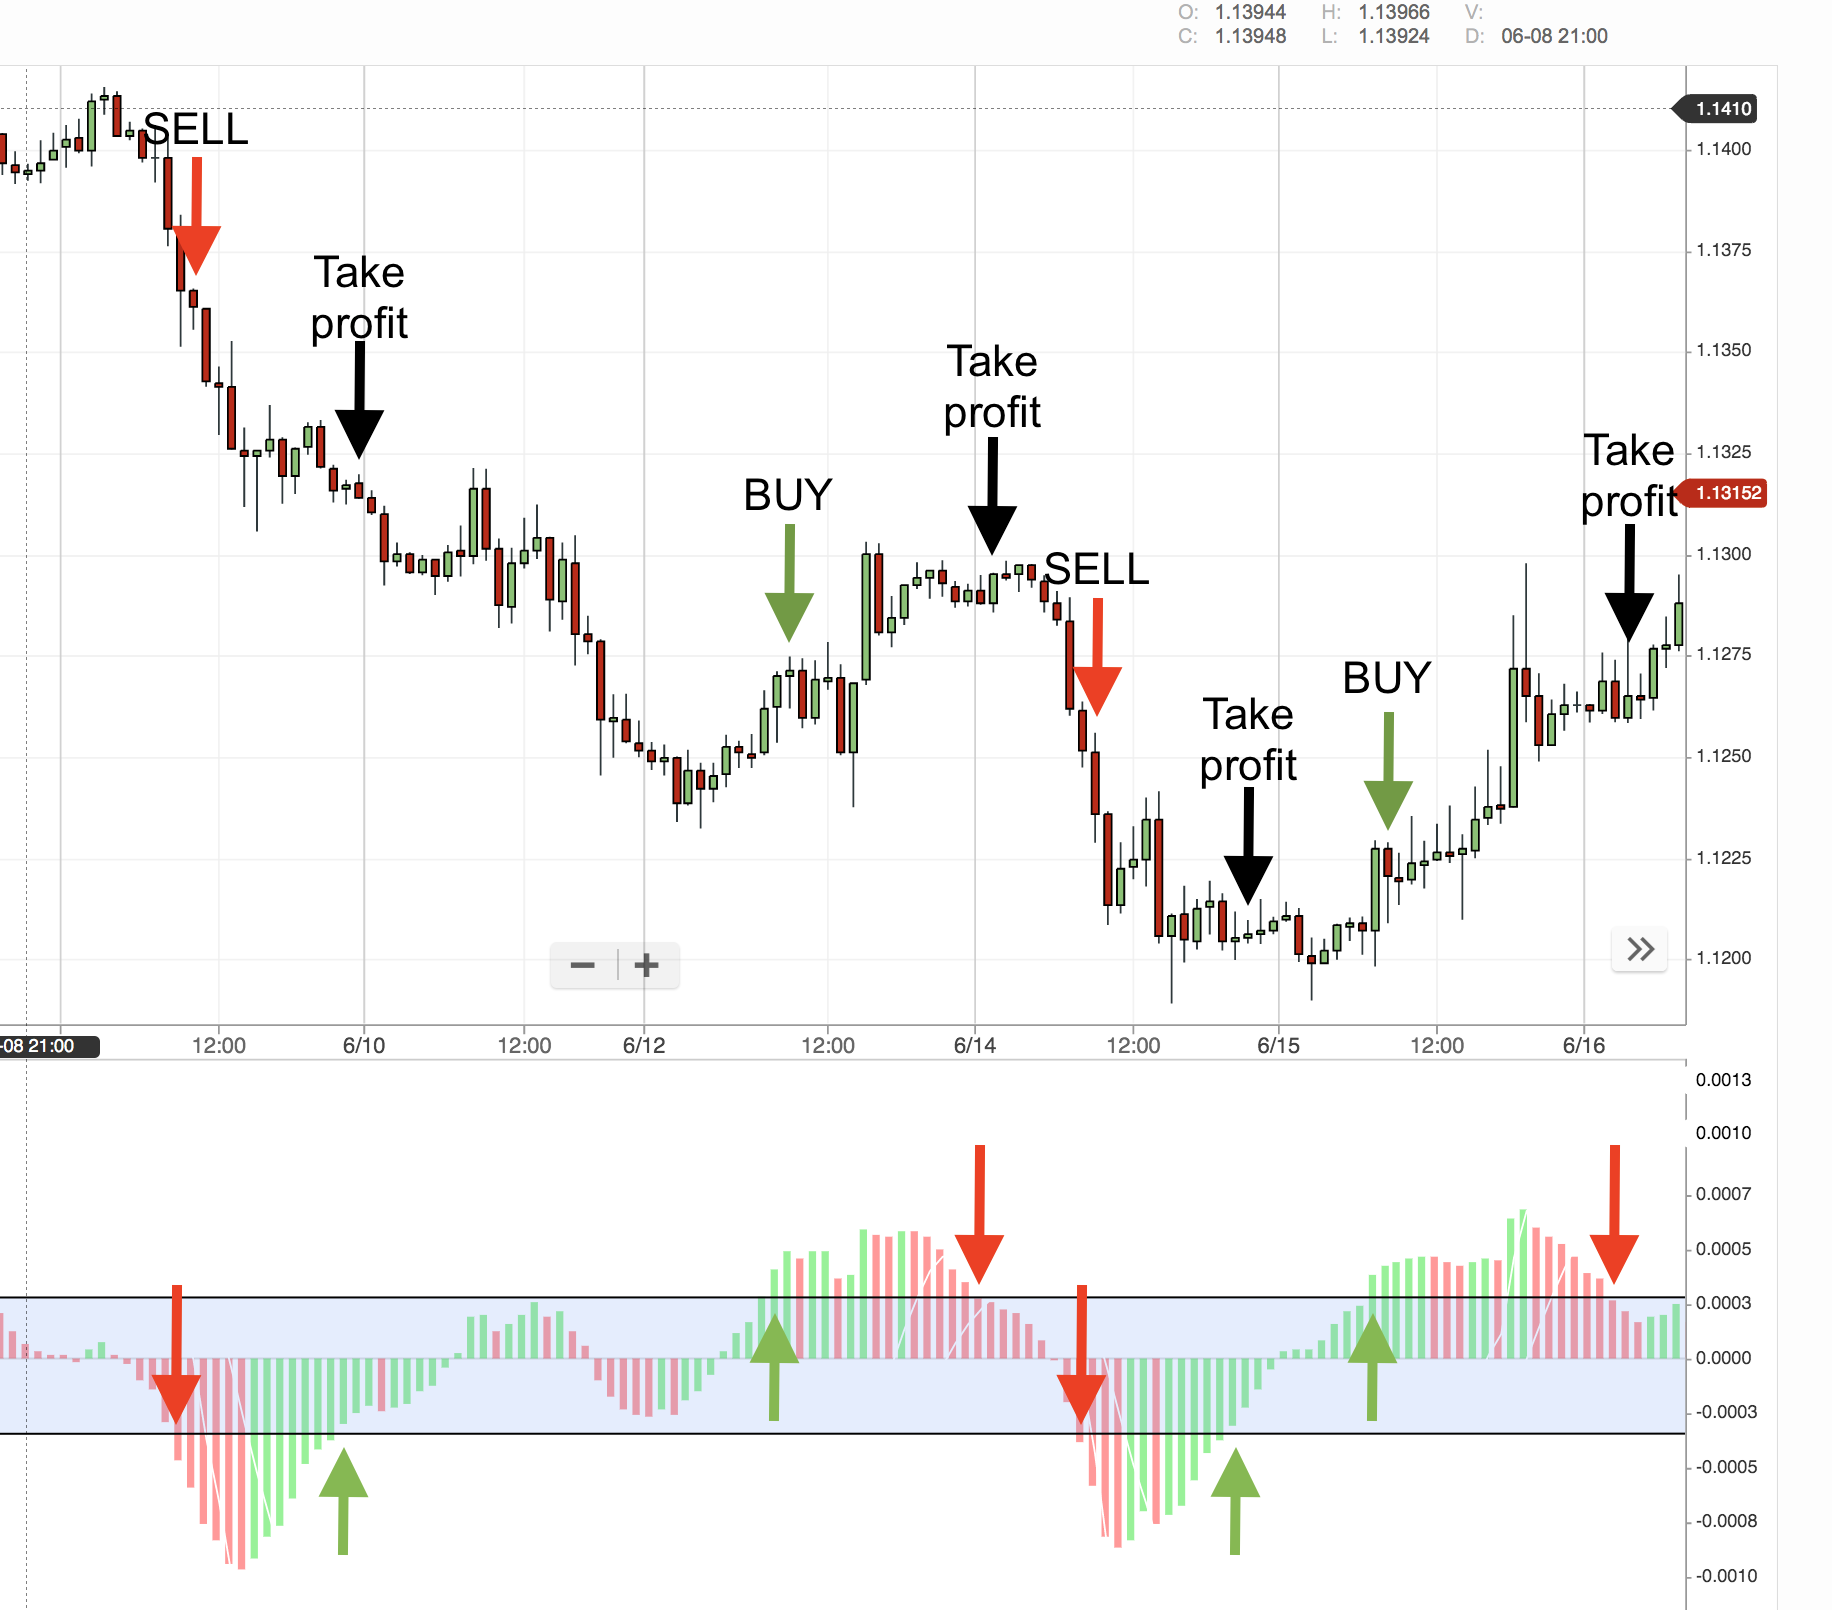
Of course, getting the size of the channel right is what’s tough here – it’ll depend on the volatility of the market you’re trading. But this is a tool it’s well worth having a play around with.
4. Candlesticks
Strictly speaking, maybe candlesticks aren’t an indicator in their own right, but what better way to picture the ‘uppy-downy’ nature (that’s a technical term) of the markets than watching what the candlesticks are doing.
Let’s put it bluntly – if we see a series of massive long green candles, we know there’s some upward momentum in the market. That’s why traders use candlestick charts, rather than line charts – they give us a great picture of momentum and its implied volume.

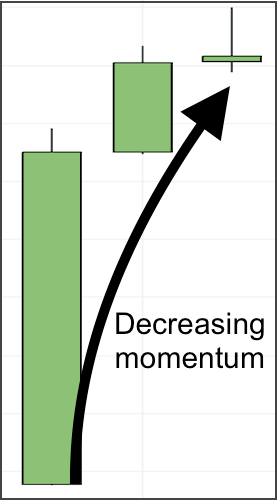
It’s as simple an indicator of momentum as you can get, and I’m always a fan of keeping things simple.
Of course, successful use of indicators is also about combining them correctly, so please check out this post of trend indicators which could be the perfect partners for your momentum indicators. Plus, you can find details of my top volatility indicators HERE.
To enjoy more content and get it faster Follow @TradersBulletin


JOIN US ...
Get full access to members-only resources, plus my weekly email updates ...
I will NEVER share your details for marketing purposes. Privacy policy
Strategies I'm Using
 It has taken 2 years to persuade this market…
- These videos show how to make 24% gains in…
 As you can see from all the data I've…
 Get the low down on the Heikin Ashi Mountain…





8 comments
Mahomed
PLEASE SEND ME FREE MOMENTUM STRATEGY.
Always interesting read.
Traders Bulletin
Sorry I missed this request Mohamed – some glitch in the form above, which I’m fixing now. I’m emailing you your copy now.
Glenn Wilson
excellent
no nonsense
thank you Mr Rose
Laurie
Hi Mark,
I incorporated your Stochastic Indicator Strategy into Diff Code today and used the lower of the two peaks on the stochastic to sell at overbought 80 ish levels.
I think I calculated the Diff levels for the day correctly and used the Diff Code level for the day to set a profit target and it hit within three hours. If I have calculated Diff Code levels correctly this could work….
Mark Rose
There’s an idea for doubling up momentum indicators here: https://www.tradersbulletin.co.uk/easy-trigger-line-trades/ – using MACD with Stochastic. I think it makes a nice combination, with MACD being based on moving averages. Of course, it’s easy to fall into the trap of adding more and more indicators …!
Laurie
Another idea to incorporate into the trading armoury – thanks so much Mark 🙂 I’ll try that next week. Fascinating stuff.
Ray
So can we put these various momentum indicators together, and would this give us some real buy/sell indications?
Paul
Very useful ! The MACD example also shows a nice standard divergence with price on the first trade which would add confirmation or possibly even an earlier entry where the negative green histogram rises to zero.