

Baltic Dry Index: the cult indicator that investors forgot
In 1744, a new sign was hung outside a coffee house on Threadneedle Street in London, reading, ‘Virginia and Baltick’.
The new name reflected the business that was carried out there – the transport of tobacco from Virginia, and fur and tallow from the Baltics. The coffeehouse was a meeting place for shipowners, merchants, seamen and pirates, where prices for transporting goods would be trashed out (often literally!).
Over the years, the place became a more civilized establishment, where deals could be closed, and in the early 1900s established itself as the Baltic Exchange at St Mary Axe.
And for the next hundred years, it became a carefully watched index for traders and economists around the globe.
Why traders care about this obscure London exchange
The Baltic Dry Index, as it is now called, is a measure of shipping costs.
Each day, shipbrokers submit prices for shipping routes around the world. These are added up and weighted to create a figure – the Baltic Dry Index.
This number – designed to help make deals easier between shipping agents and customers – was a gift to economists.
You’ll have heard of lagging indicators (which give signals after the event), and leading indicators (which try to predict events, with varied success) … the Baltic Dry Index was something different … a coincident indicator. This is an indicator that gives a snapshot of what’s going on RIGHT NOW.
Supply and demand means that if more raw materials, like iron, coal, grain, are being shipped around the world, then prices for that shipping will go up. If there’s a drop-off in demand, prices will go down, indicating a global slowdown in manufacturing and construction.
Over the years, this has proved itself to be a very reliable indicator of strength in the global economy. The chart below shows how the BDI price compares to the S&P and the Shanghai index – and we can see strong correlation, which seems to break down around 2010 …

So, what went wrong with the BDI indicator?
Between around 2010 and 2013, China started a huge ship-building program, effectively doubling the number of cargo vessels carrying goods around the planet. The result of all this extra supply meant that charter rates fell sharply.
Economists and investors fell out of love with the BDI, because it became tricky to read what it was telling us.
So, when the BDI fell sharply last year, doom-mongers on conspiracy-loving channels took great pleasure in telling us that the world economy was collapsing …
While sage economists told us to ignore it, because the BDI was no longer a reliable measure.
Who was right?
As usual, the truth is more nuanced that either side of the argument would have you believe.
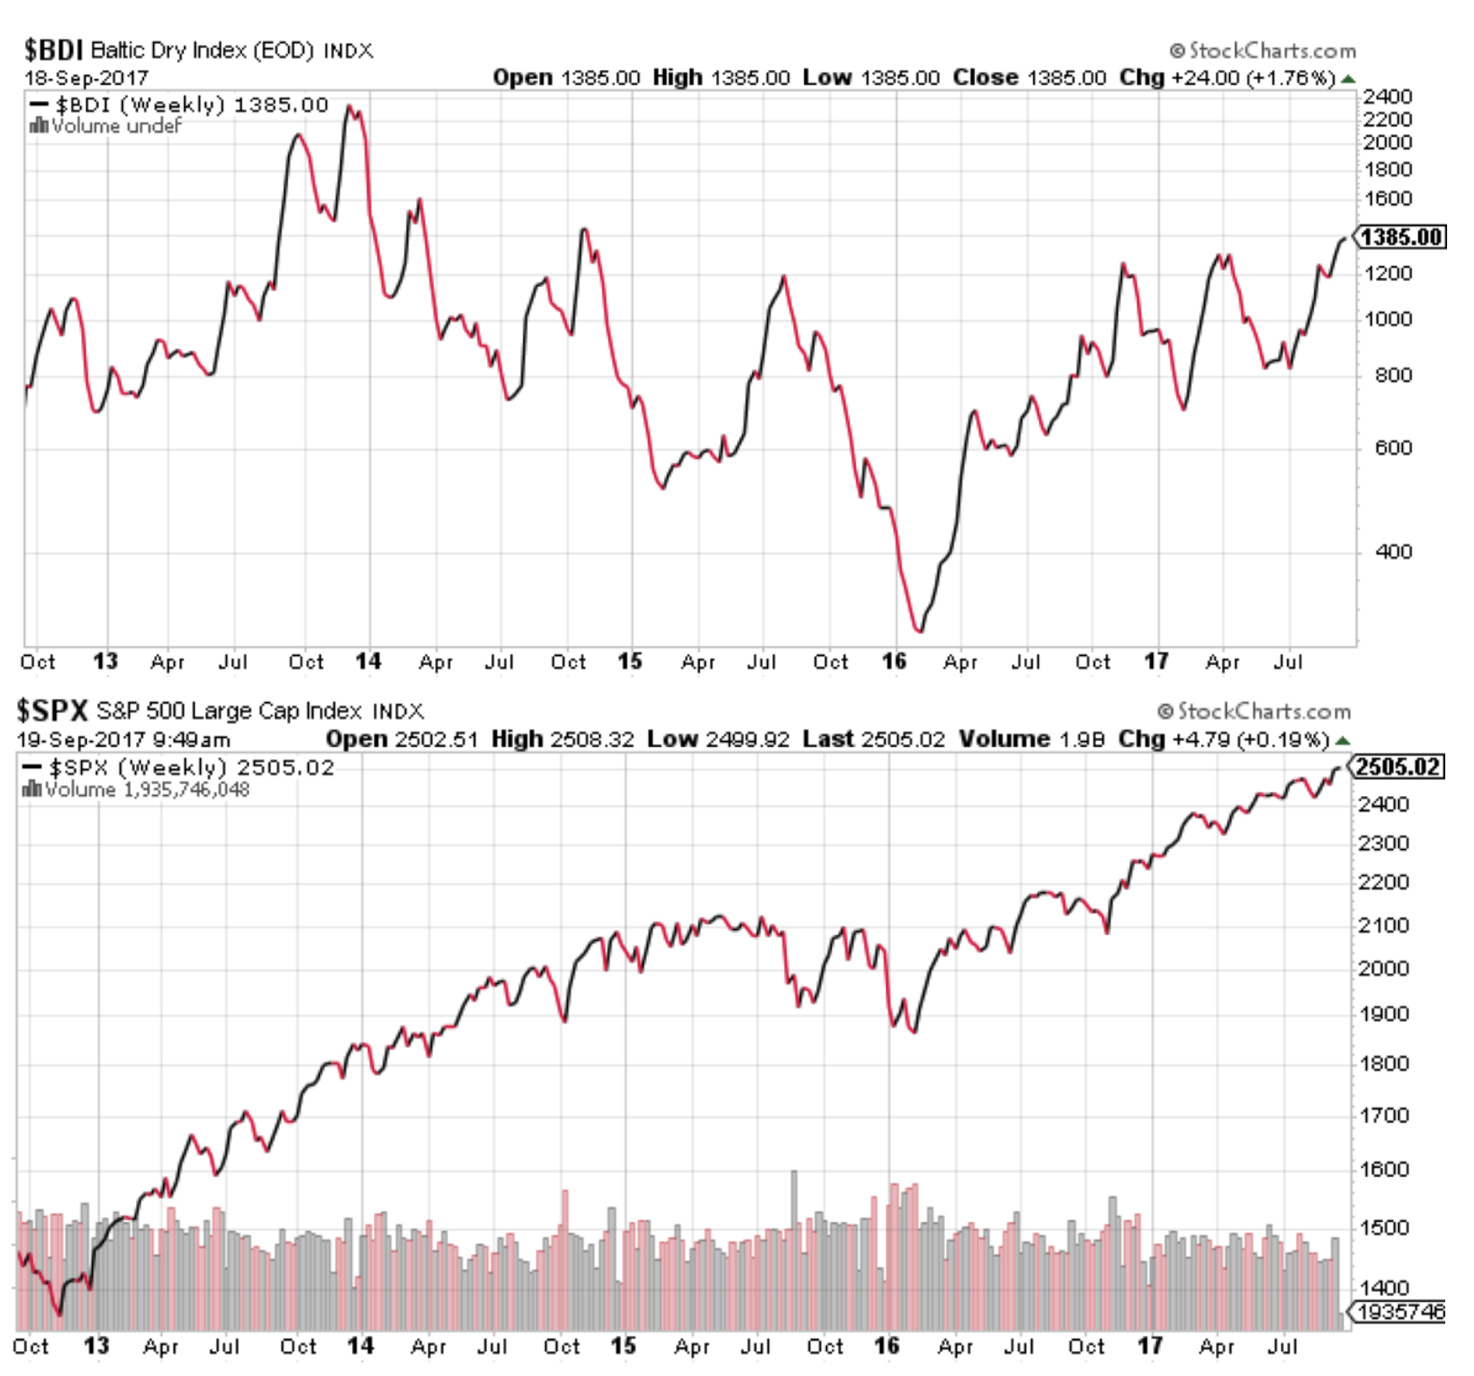
The chart below shows how the Baltic Dry Index was falling for much of 2014 and 2015, while the S&P kept climbing. It’s little wonder that investors stopped listening to it. But then big drops in the latter half of 2015 did coincide with market drops.
Of course, even a stopped clock will tell the right time twice a day
And uncorrelated markets will sometimes move in unison. But perhaps we’re seeing signs of the Baltic Dry Index become a useful tool again.
As you can see, the Baltic Dry Index, and the strength of the global economy are far from perfectly correlated. There are too many other factors, like shipbuilding … oil prices … reshoring (the trend of manufacturers creating local supply networks rather than shipping huge distances).
So we need to be wary of thinking along the lines: the BDI is rising, so global markets are strong … the BDI is falling, global markets will weaken.
But that doesn’t mean that we should ignore what the Baltic Dry Index is saying. There’s no denying that shipping costs have a story to tell us about what’s going on in the global economy – even if that story takes a bit more picking through than just reading a number off a chart.
It’s hard to look at the BDI moving towards 3 year highs and not feel a sense of optimism in global markets.
But if you’re interested in using a significantly more accurate correlation to make money … and one that doesn’t depend on the ups and downs of global markets …
… then please watch out for my email next week with more details of a market that’s made 53% profits this summer alone (July & August 2017 results).
To enjoy more content and get it faster Follow @TradersBulletin
Related posts:


JOIN US ...
Get full access to members-only resources, plus my weekly email updates ...
I will NEVER share your details for marketing purposes. Privacy policy
Strategies I'm Using
 It has taken 2 years to persuade this market…
- These videos show how to make 24% gains in…
 As you can see from all the data I've…
 Get the low down on the Heikin Ashi Mountain…




