

How to double your money – when the price goes the wrong way

Today I’d like to talk about a price action that’s very common, yet is rarely discussed.
It’s a pattern that too often causes traders to lose money.
However, if you understand it, there’s absolutely no reason why you should lose on this. In fact, you can use your knowledge of this pattern to reduce your risk – or even to double your profits.
What I’m talking about are throwbacks and pullbacks.
Recognizing throwbacks and pullbacks
Throwbacks and pullbacks occur when the price breaks through a significant level, usually with some momentum, and then retraces back to that level before resuming direction.
A throwback occurs when a resistance level is breached …

And a pullback occurs when a level of support is broken to the downside …
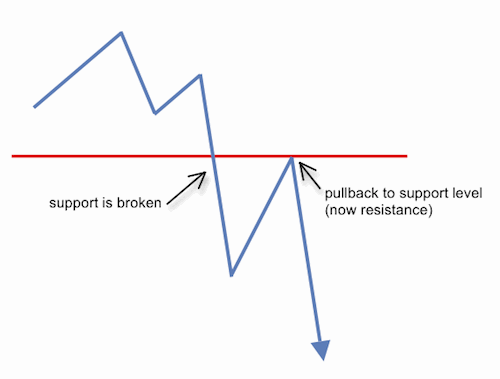
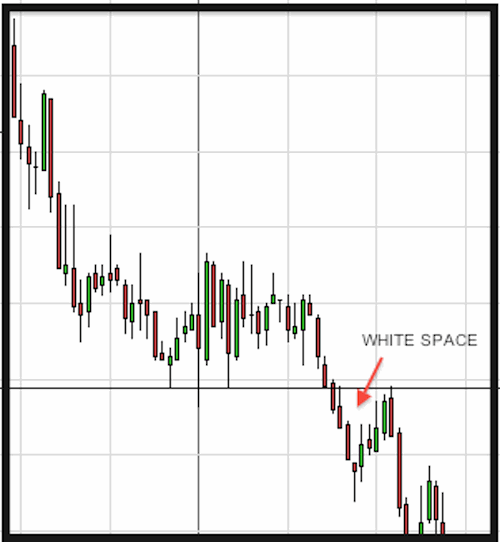
To constitute a throwback or a pullback (as opposed to an area of congestion just beyond the support/resistance level) – we need to have some “white space”.
Why traders don’t appreciate the value of these patterns
Having your price bouncing off that support/resistance level, is a great way of confirming the breakout. That works well for the patient trader who waits for this pullback. However, what happens more often is this …
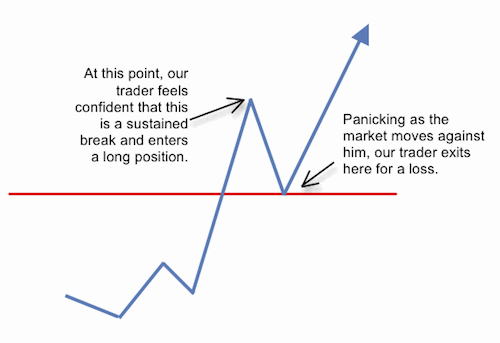
Too often, these pullbacks and throwbacks become the bane of a trader’s life.
There is no reason for this to happen – as with most things in life, if we understand what can happen, and why it happens – we’re automatically ahead of the game.
Normally a throwback will occur when there is a high-volume breakout. Following that break, it is usual for the momentum to wane, resulting in the retracement that we see in these patterns.
Only then does the price resume the direction started by the breakout.
A neat bounce off this line will give us a clear entry level. However, as we’ll discuss in a moment – the bounce isn’t always as tidy as those in the diagrams above.
How to use this knowledge
Thomas Bulkowski is a trader I have a lot of respect for. However, if my family think I spend too much time staring at financial charts – I expect that his family have forgotten what he looks like.
In gathering evidence for this chart pattern, Bulkowski has studied a modest 12,256 examples (!). And in that research, he found that 53% had throwbacks, and 56% had pullbacks.
So, if you’re looking for a low-risk filter to put onto a breakout trade – waiting for a pullback or throwback should offer you confirmation in over half of cases. (You’ll miss out on some trades, but those you enter should give you a higher success rate – plus it can have a beneficial effect on your risk-reward ratio, as I’ll explain in a moment.)
But there’s another way to look at this …
If you’re an agile trader, you can profit from both moves – picking up the move on the initial breakout, and again, on the bounce off support/resistance.

Of course, judging these levels is going to be difficult. Bulkowski’s research shows that the most likely gain is six to eight per cent, over three days (obviously, this is looking at medium-term trades).
When it gets messy
Pullbacks and throwbacks are often less tidy than the examples I’ve shown you above.
Often they will retrace to beyond the breakout point.

If you’re already in the position at this time, you’ll need to be mindful of where you place your stop loss – and of the knock-on effect that a wide stop loss will have on your risk-reward ratio.
A more conservative option is to wait for the bounce off the support/resistance line before you enter your trade. Be aware that the bounce might not happen neatly off that level, but by trading after the bounce, you can afford to trade with a tighter stop loss – which, in turn, can improve your risk-reward ratio.
Working with the pullbacks
There are a few simple lessons we can take from throwbacks and pullbacks, and by doing so, we can use them to enhance our trading, rather than battle against them.
The main thing to remember is that if the price moves against you after a breakout – don’t panic. It is very normal for the bulls and bears to have a little tussle like this as a new trend is established.
It is not easy to pick the beginning of a trend, because new trends are characterized by exactly this kind of behaviour. By understanding pullbacks and throwbacks, you’ll get better at spotting new trends – and making profits from them.


JOIN US ...
Get full access to members-only resources, plus my weekly email updates ...
I will NEVER share your details for marketing purposes. Privacy policy
Strategies I'm Using
 It has taken 2 years to persuade this market…
- These videos show how to make 24% gains in…
 As you can see from all the data I've…
 Get the low down on the Heikin Ashi Mountain…





2 comments
Paul Wilson
Clearly written article. Thanks Mark.
Here’s a suggestion to keep out of trouble near a Resistance level.
In the first hour or so from market open, check the current and previous – pair of candles on 15 min chart (day trade). Look for colour change.
Step 1. Wait for a G ‘previous’ candle and a R ‘current’ to be revealed.
Step 2. R ‘current’ now becomes R ‘previous’. Watch and wait a further 15 mins for current candle to complete and reveal itself.
Step 3. Was it Red? You’ve got it. A shining pair of Red candles.
Step 4. Now you’re in better shape to ambush (await) your entry near a Resistance level … after the open in morning session.
Regards
Paul Wilson
Ps. I love your photos. Good choice this week … deflated yellow duck
Mark Rose
Thanks for the feedback and suggestions Paul – it’s all about having the patience to wait for those candlesticks to form. We’re often so scared of missing an opportunity that we jump in too soon!