April 25, 2014by Mark Rose- 12 comments
Why traders don’t use volume indicators (and why they should)
Before we look at volume and volume indicators, let’s consider what affects prices …
Lots of people want to buy something … the price goes up.
Lots of people want to sell it … the price goes down.
No one is buying or selling … the price stagnates.
So, one of the primary drivers of price moves (up or down) is the volume of trades going on.
Sure, volume can’t tell us which way a price will move – but it can give us a really good idea of WHEN prices will move.
There’s just no denying that volume is important.
So, why do so many traders fail to use a volume indicator in their calculations?
Quite simply because it’s difficult to quantify.
If you’re spread betting, then nothing is actually changing hands – so, in theory, there’s no volume. Therefore no volume indicator. But that doesn’t mean that the volume of traders buying and selling isn’t affecting the price behind the scenes.
And on spot FX markets, volume isn’t recorded as the trades aren’t conducted through just one exchange (unlike futures prices).
So, we’re left with a conundrum. We know that volume matters – so, how can we get a meaningful volume reading that will actually help our trading, when no volume measure exists?
One solution that many traders use is simple candlestick size.
A big candlestick (including wicks) suggests that there’s been a lot of activity in that time period.
A short candlestick suggests that things have been quiet.
It’s not a bad compromise – it’s quick and simple to apply – but it is a compromise.
The solution I want to show you here gives a very accurate picture of activity – and is just as clear and intuitive to read off your charts.
It’s a new kind of candlestick that can revolutionise your trading …
As we saw above, we’re used to candlesticks being red and green, or white and black, according to whether the price has gone up or down.
These new candlesticks use colour in a different way.
The colour tells us how much activity has gone on during the period of that candle. Every time the price ticks up or down (a tick is the smallest movement the price can make), then we know there are buyers and sellers at play. And it’s exactly this activity that our candlesticks are measuring.
If activity during that period is extremely high, then the candlestick is coloured red.
If activity during that period is extremely low, then the candlestick is coloured blue.
If the activity is average, then the candlestick is green.
And that’s it – a clear picture of volume on a candle-by-candle basis, at a glance.
As you can see in the image here, the length of the candlesticks doesn’t always relate the how much activity has been going on. The red candles show extremely high activity; the blue candles show extremely low activity; and the green candles show average activity.

If you’ve come across these candlesticks before, you’ll probably know them as ‘extreme candles’, and the beauty of them is that they act like flashing beacons to us – telling us where the action is (and isn’t) happening.
Extreme candles can warn us about ‘timebomb’ candles about to explode into action …
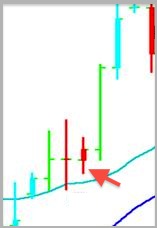 Here’s an example of an innocent-looking little candlestick, that might escape our attention on a normal chart …
However, because we can see that this candle has extremely high volume, combined with its tight trading range, for us it paints a clear picture of buyers and sellers battling it out – this is a good indicator that prices are about to explode out.
With the help of these extreme candles, we now know which candles really matter – which ones show traders actively battling it out, the bulls vs the bears. And which candles show that traders are just plain apathetic.
I’m very excited about using these new candlesticks, and next week I’m hoping to show you some excellent trade set-ups using them …










12 comments
Alan
Hi Mark,
Is it possible to use this scheme on the IG Index platform?
Thanks,
Alan
j
OK, so let’s modify Heiken Ashi candle code for MT4 to colour candles by volume – basically putting BetterVolumeIndicator into the candle.
Ray
I guess it would be possible to build an MT4 indicator that measures tick volume and produces an appropriately coloured candle……….umm!
Vittorio
Thanks for info. I am eager to read and understand more about that.
Kelman
How can up to the minute volume in the worldwide forex market be known?
Mark Rose
Hi Kelman, you’re right – it’s nigh on impossible to get a measure for volume on forex, given that it’s not run through a single exchange. But by measuring the tick-by-tick action on the candlesticks we can get a really good idea of the level of activity on an instrument. Plus, this is really good for highlighting the struggle going on between bulls and bears.
Paul H
Volume is the third variable after price and time which few people use and even fewer ‘gurus’ teach. There are various volume indicators such as Overall Balance Volume; Money Flow and Accumulation/ Distribution on MT4 although they cannot tell you much about Forex volume but are useful for stocks. Other Charting platforms like TC2000 and Metastock have some very good proprietary volume indicators that can tell you what the market makers/ institutions are doing.These extreme candlesticks look very useful and I would like to know more.
Mark Rose
Glad you like them – I’ve been really taken with this way of trading. I hope to bring you more details on how you can start using them soon.
tim
mark,
where can we get “extreme candles” for MT4 platform?
tim
Neil
Where can this be downloaded for use with MT4 ? Looks useful ! Thanks
s m waller
What a brilliant idea. I have long been searching for a volume indicator other than the horizontal histogram at the base of a chart. Question – where can you download it – it is not on the usual MT4
maurice
where does one access these candles?