Trading power couples: how to pair your indicators for success
Whether you’re networking to advance each other’s careers … or remembering to put the bins out because your other half forgot … a team effort can really enable success.
And when it comes to indicator pairings, some will have nothing extra to offer each other, while the right couple of indicators will enhance each other’s qualities.
Why we need more than one indicator
I’m slightly wary of all-singing all-dancing indicators which promise to do the whole job for you – predicting direction, momentum, volatility …. In theory, it’s a great idea. But in practise, it’s hard to match a complex indicator to your individual trading needs, and it can be tough to fathom where things are working and where they might need tweaking.
But your bog-basic one-job indicator is never going to be enough on its own.
Your indicator might measure price levels … tell you how quickly prices are changing … how wide recent highs and lows have been …
This is all useful stuff – but it’s not enough to risk your money on.
Indicators need a ‘better half’ to fill in the gaps, so the weaknesses of one party are balanced by the strengths of the other.
The first indicator gives you the signal …
… the second indicator confirms that this is a strong enough signal to risk your money on.
But not all indicators are suited to work together.
When you’re looking for your second indicator, it needs to bringing some new information, rather than the same information, just shown in a different way.
For example, if you back up your moving average with a MACD … you may find that you’re just looking at the exact same data. Yes, the second indicator will confirm the signal in the first, but that’s because it’s doing the exact same job.
So, here I want to show you two indicator pairings that complement each other perfectly …
Best indicator pairs: Moving Average & RSI
Here we’ve got two very common and popular indicators combined. The moving average is all about spotting the formation of trends based on the direction that the price is moving in.
The weakness in moving averages is that they are lagging, so we want to add an indicator that’ll point to some momentum behind an ongoing move that’s been spotted. Cue RSI – a momentum indicator based on the speed of price movements.
Here’s the setup:
Timeframe: 4 hour
Indicators:
12 & 14 period moving averages
RSI (15)
Signal to buy: The 12 MA crosses above the 14MA AND the RSI is >50
Signal to sell: The 12 MA crosses below the 14 MA AND the RSI is <50
Best indicator pairs: Stochastic & MACD
It’s easy to think, when it comes to indicators, that if they look similar, they’re giving similar information.
Which is why the oscillator MACD is over bracketed together with momentum indicators like Stochastic or RSI.
In fact, the MACD is all about moving averages, and gives information about the trend, as well as adding in data about how multiple moving averages are changing in relationship to each other.
The result is that we have an intelligent trend indicator. Add a momentum indicator, like Stochastic to that, and we have a great way to trigger a trade …
Here’s our set-up …
Timeframe: 15 minutes
Indicators:
MACD (12)
Stochastic (14)
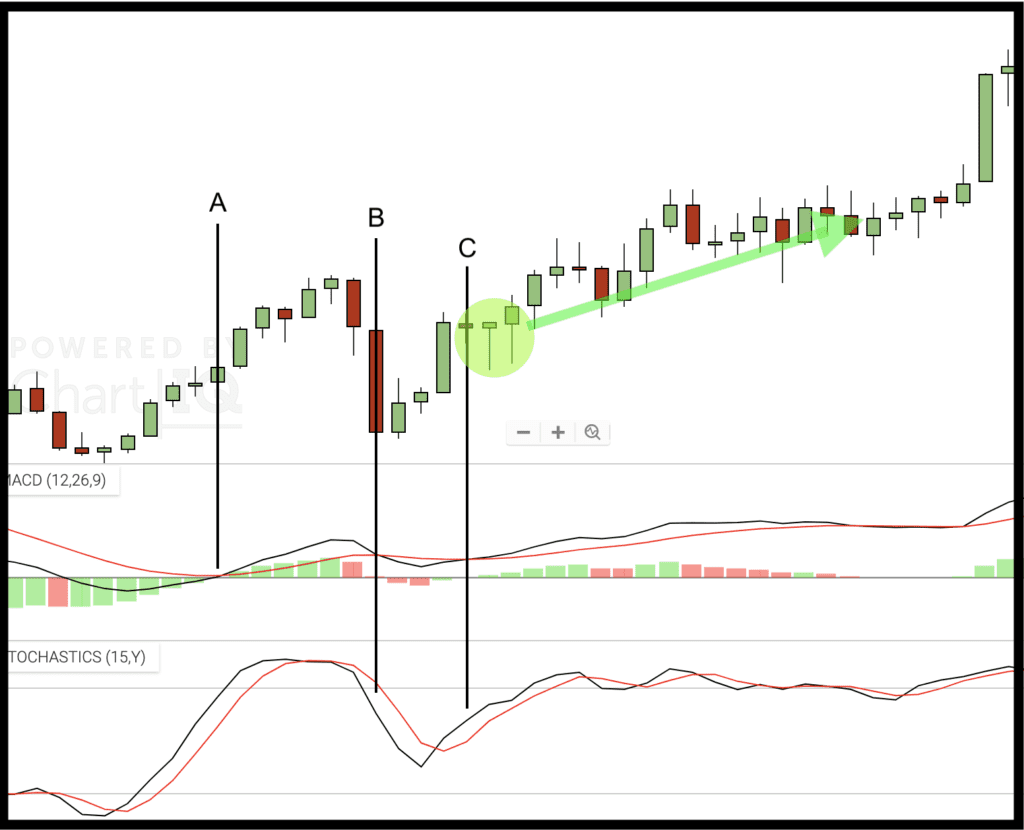
Signal to buy: The fast MACD line crosses above the slow MACD line and the fast Stochastic has crossed above the slow Stochastic within the previous 2 candles
Signal to sell: The fast MACD line crosses below the slow MACD line and the fast Stochastic has crossed below the slow Stochastic within the previous 2 candles
At ‘A’ and ‘B’ on the chart above, we have MACD crossovers, but no recent crossover on the Stochastic, so no signal. This suggests that a new trend doesn’t have strong momentum behind it, or that a trend is running out of steam. At ‘C’ however, we get both crossovers occurring within 2 candles, signalling an opportunity.
Making the pairing work
If the two indicators you choose are too closely related, you’ll get a lot of agreement between them – which might feel reassuring – but is actually just doubling up the same information.
We need our second indicator to ADD and FILTER – not to just repeat what the first indicator told us.
Indicators fall into a number of categories: trend, volume, momentum, volatility … and more.
The crucial ones to get us started are trend and momentum/volume. Volatility can be the next useful ingredient, to give us trading parameters.
As well as combining these types of indicators, look at mixing up speeds, with lagging and leading indicators. Something like Stochastics is sensitive, but gives a lot of false, jumpy signals, triggered by market noise. Combining this with a slower, laggy trend indicator can be a good pairing.
And the crucial tip for success with your ‘power couple’ indicator pairing is to be realistic. A great match doesn’t mean it can perform magic – the world will keep throwing news at us and markets will still do what they like. A trading setup is just that – a good-looking opportunity to get into the market. Whether you then make that setup work for you will depend on how you manage your trade, and what fate throws at you.











2 comments
David Farmer
Hello Mark,
I have purchased from you the HAV Trading Method. Could I please obtain the Hav Trading Journal that you mentioned ?
Regards, David
Traders Bulletin
Hi David – I’ll email you directly with details of how to access this.