

Zone indicators: the first step in finding your setup

A lot of trading should involve doing nothing. Sitting on our hands because market conditions aren’t right.
It can be frustrating, and it’s tempting to keep looking for a setup because we’re at our screens and feeling ‘ready’ for an opportunity.
That’s why a good ‘zone indicator’ can keep those urges in check, telling us when to look for trades, and when to look away!
What is a trading zone
A trading zone is simply an area where the conditions become interesting enough for us to start looking for a trade. Outside that zone, we do nothing. Inside it, we start paying attention.
That distinction matters, because the zone isn’t the signal. It’s a filter designed to stop us wasting time — and money — taking setups in the wrong place.
It can tell us that a setup in this region will have a better chance of success and/or that the reward-risk ratio is favourable.
If you’re price-action trading, a trading zone might be bumping up against support or resistance, or within a consolidation pattern. But here I want to show you some indicators that’ll give you a clear yes/no reading for whether you should be trading … or finding something else to do with your time …
Bollinger Bands
Bollinger bands are really useful tools that combine a moving average with a volatility measure, creating a price ‘channel’. The price can bump along within this range, or it can break out of the range, which means that Bollinger bands are used by range traders and breakout traders.
This gives us dynamic upper and lower price zones – an interaction with the band is an alert to look for a setup.
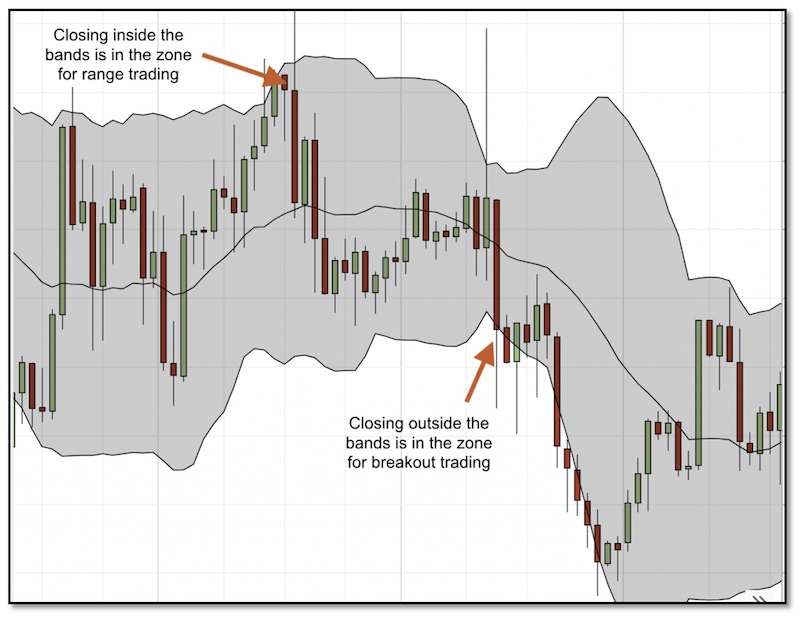
What’s crucial here is that interacting with the Bollinger bands is our ‘wake up’ call. The ‘zone’ itself isn’t a trading a signal. It simply tells us: pay attention now. This is where we start looking for the actual setup.
Moving Averages
Moving averages often act as areas of support or resistance in trends, so an interaction with an MA line can be an indicator that we’re in the trading zone, looking for a signal to trade.

However, moving averages can also give us much wider trading zones, just by being above or below a moving average. If the price is above the moving average, we can be in the ‘buy’ zone; below the moving average, we’re in the ‘sell’ zone.
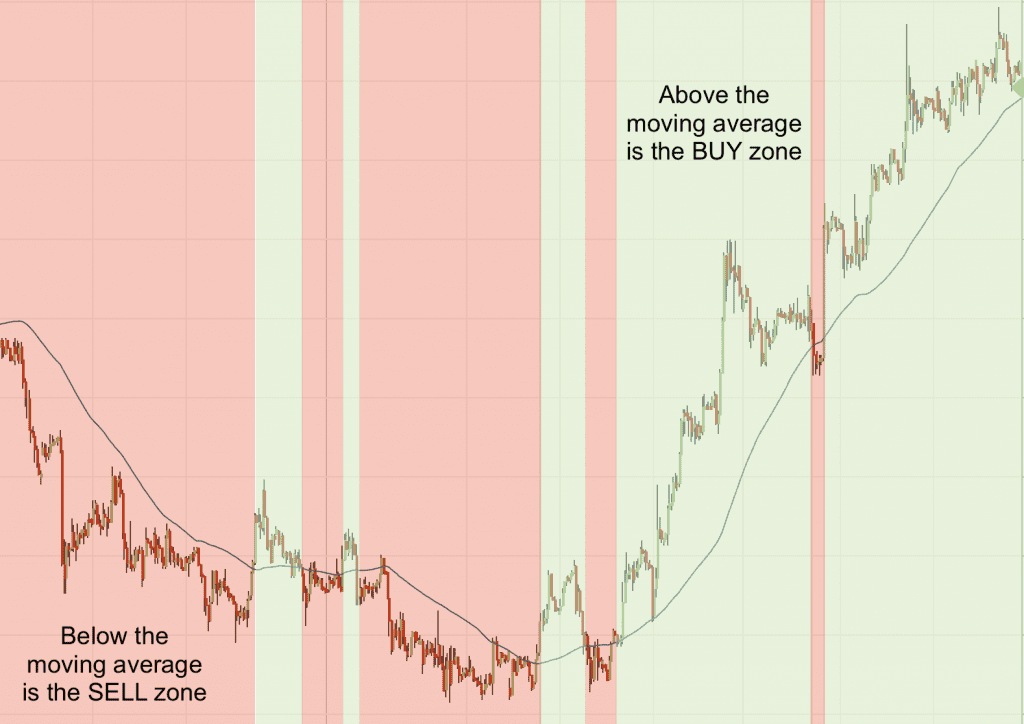
This means that any BUY signal received in the SELL zone, can be ignored, and vice-versa.
Ichimoku clouds
Ichimoku clouds can be used like the moving average above/below buy/sell zones – but they’re a bit more sophisticated.
With the Ichimoku indicator, we’ll only look for buy signals if the price is above a green cloud. And we’ll only look for a sell signal if the price is below a red cloud …

The Ichimoku indicator can do a lot more than just give zones. If you’d like to find out more about it, please check out this post HERE.
RSI overbought / oversold zones
RSI is probably the classic example of a zone indicator. Rather than focusing on one precise level, traders typically watch the areas above 70 and below 30, which are traditionally described as overbought and oversold. But those labels can be misleading. An overbought market isn’t necessarily about to fall, and an oversold market isn’t necessarily about to bounce. In a strong trend, RSI can remain in one of these zones for a surprisingly long time while price keeps moving in the same direction.
So, it’s better to think of these areas as warning zones rather than reversal signals. When RSI pushes above 70, it tells us that buying has been unusually strong and that the market has become stretched, giving us reason to start watching for evidence of a reversal. Below 30, the opposite applies.
While, the standard overbought/oversold levels are 30/70, when looking for trading zones, it can be more useful to use for a wider range. For example, only taking sell signals if the RSI is >60; and only taking buy signals if the RSI is <40 …
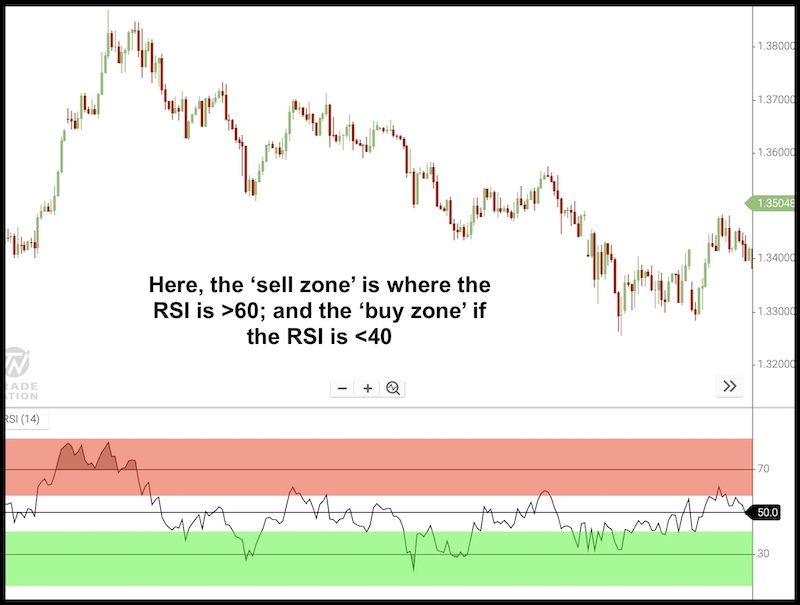
As with all these zone indicators – these are areas to start looking for opportunities, not the opportunities themselves. The important thing is to wait for some evidence that momentum is actually turning before trading against the prevailing move.
SMC premium and discount zones
Premium and discount zones used in Smart Money Concept trading are an obvious candidate, but don’t fall neatly into an ‘indicator’ category. For that reason, I’m going to give them their own investigation next week. So please watch out for my next update.
Related posts:


JOIN US ...
Get full access to members-only resources, plus my weekly email updates ...
I will NEVER share your details for marketing purposes. Privacy policy
Strategies I'm Using
 It has taken 2 years to persuade this market…
- These videos show how to make 24% gains in…
 As you can see from all the data I've…
 Get the low down on the Heikin Ashi Mountain…




