Are you still making these 3 errors at key levels?
Trading the markets without using key levels is like shooting in the dark. Interesting candlestick patterns occur all over our charts, but they’re only useful when they coincide with a key level.
Of course, it’s impossible to predict the future of price behaviour, but key levels give us the best clues we have – so we’d be fools to ignore them.
However, even if you recognise the power of these levels – if you’re using them wrong, you’ll struggle to make money. Which is why here I want to show you 3 crucial errors that many traders make when drawing in levels and using them.
Error #1: Drawing lines
The first error many traders make comes with the initial process of drawing lines on our charts.
The text books tell us that we just need to line up the candlestick highs and lows, and the more often those levels are hit, the stronger that support/resistance is. And we then come to expect a neat bounce off our neat line. Right?
Unfortunately, this belief it the main reason so many traders become disillusioned with trading off S&R levels.
The reality is that support and resistance can be messy. A key level will be scattered with buy and sell orders from traders looking to enter or take profits or cut losses at this level. And this means congestion.
It’s exactly this kind of messy price action that gets us into trades that are going nowhere, and knocks us out of them prematurely.
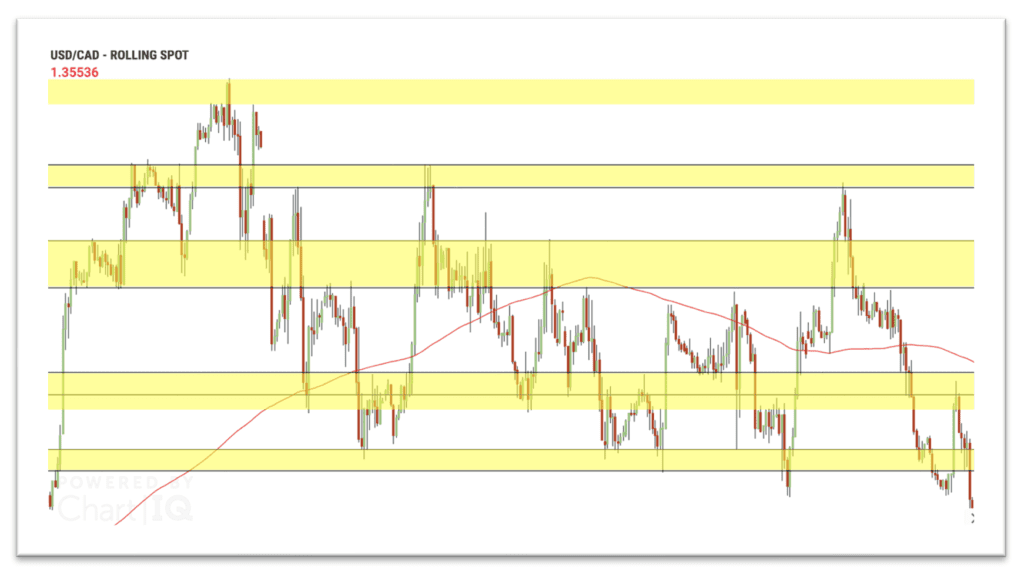
That’s why I’d urge you to look at AREAS of support and resistance. If possible, draw them in this way on your charts.
And, in a moment, I’ll show you how these bands can be used to our advantage to pinpoint the best opportunities.
Error #2: Fearing the power move
A price reversal within a well-establish range can feel a lot safer – we’re often told that the more times a level is hit, the stronger that level is, so what could be safer for a reversal, than within a neat channel?
The problem with this comes with profit potential.
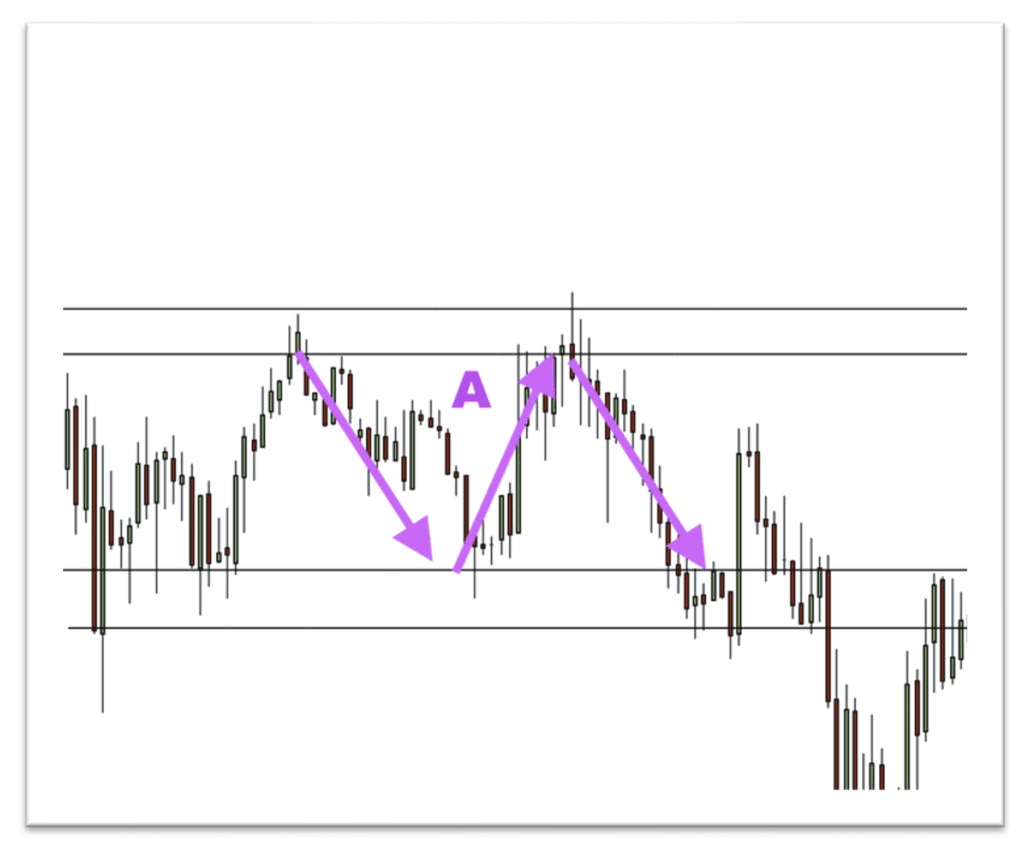
A reversal within a tight trading channel doesn’t give the price far to run to a profit target.
In the example above, we can see that picking up profits by trading the channel at A can be limiting, with a poor reward-to-risk ratio.
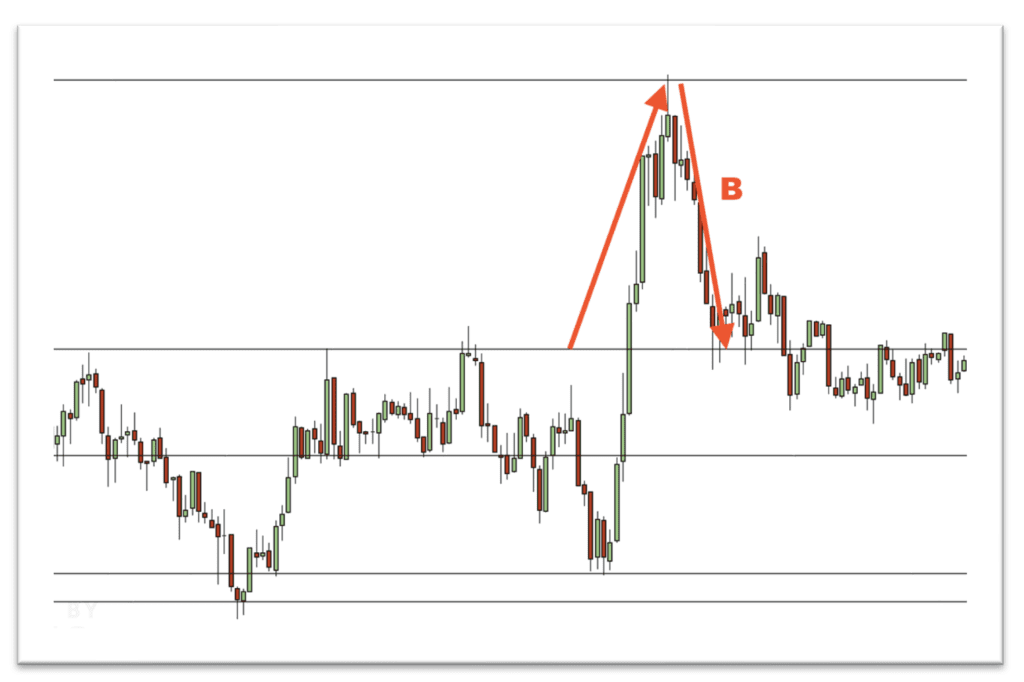
By contrast, a power move, out of the usual ‘zone’ can offer huge profit potential when the price reverses. On the chart below, when we get a strong move up, this leaves little in the way of support to stop the price when it bounces back at B.
These kinds of trades offer a much better reward-to-risk, making it a smarter place to risk our money.
Error #3: Not letting losing traders accelerate your profits
By using support and resistance channels rather than lines, we’re able to put together a picture of how other traders’ orders are being filled. By watching and understanding this – we can use that know-how to boost our profits.
Once you know what to look for – it’s dead easy.
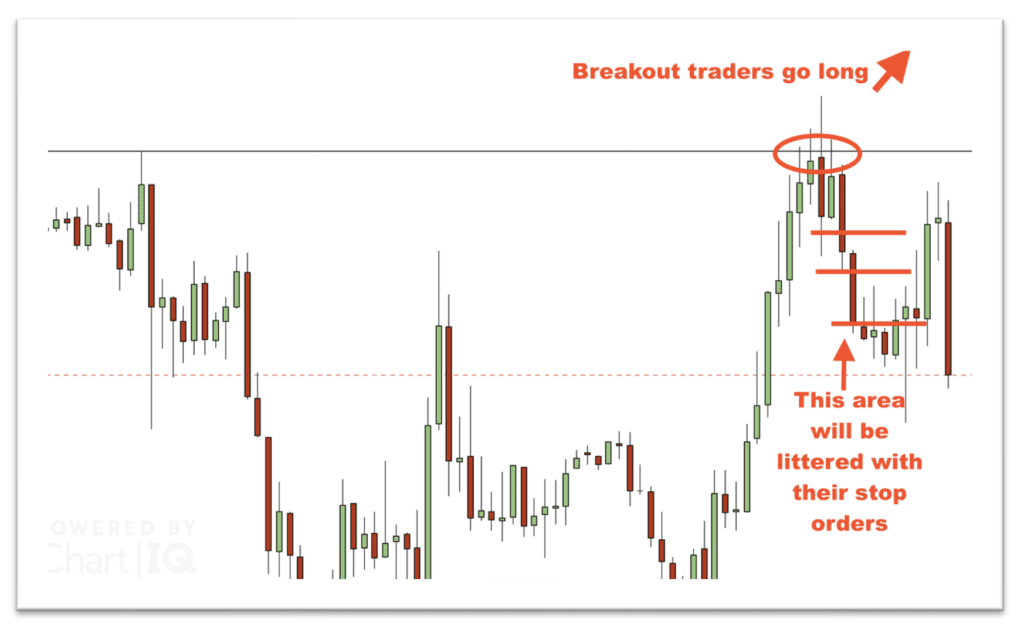
In the example below, the price has breached the recent high. If you’re trading off resistance as a straight line, this could be seen as a breakout, and an opportunity to go long.
But, if you’re patient and accept that S&R areas are inherently messy – this is a golden opportunity. By selling this reversal, you have the stop levels of breakout traders, which will drive the price down hard towards your profit target.
Reading between the lines
Key levels are so much more than just lines on a chart. They’re turbulent areas, where we really see the push and pull of bulls and bears at work. If you practice seeing them this way, you’ll quickly learn to spot the levels that are worth trading from, and those that don’t deserve effort – and you’ll see the difference in your profits.