

Profit Zones: the crucial factor in a high-probability setup. Here’s how to find them …

The first question a trader should ask, before they start looking for a signal … is: Are we in the profit zone?
If the answer is ‘no’, then you don’t need to look further. Sit tight for now.
If the answer is ‘what profit zone?’ … then you’ve come to the right place. Keep reading …
Profit zones 101
The profit zone for any trading strategy is the area the price needs to be in for us to even consider trading. These zones tell us that an opportunity could be about to setup … and that this opportunity could be worth our attention.
Exactly how you find your profit zone will depend on the trading strategy you’re using. But here I’ll look at five simple tools you can use. Just pick the one that suits you best …
Moving averages
A moving average crossover is a simple and powerful profit-zone tool. If the price is above the moving average, we’re in an uptrend, and so open to buying opportunities. If the price is below the moving average, we’re in a downtrend, so open to selling opportunities.

Bollinger bands
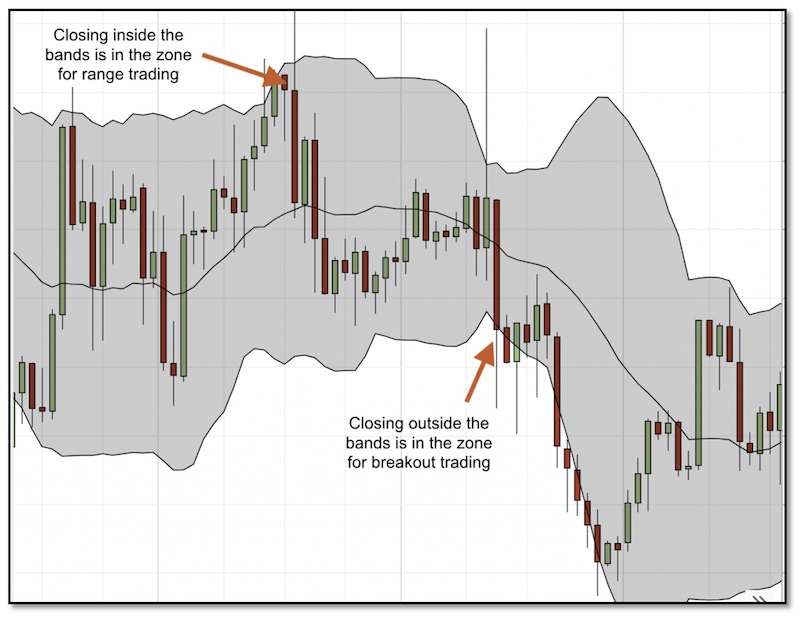
Bollinger bands are a good zoning tool for both breakout and range traders.
The price can bump along the Bollinger channel, or it can break out of the range – what’s crucial is that our ‘zone’ alert comes when the price is interacting with the upper or lower band …
Ichimoku clouds
Ichimoku indicators can be used in many ways, but stripped down to basics, they have a built-in zone indicator – the red and green clouds.
You can look for buy signals if the price is above a green cloud. And sell signals if the price is below a red cloud. If the price doesn’t fit into one of these zones – we should be sitting out of the market.

Linear Regression Indicators
Linear regression indicators give us information about how the price is behaving in relation to an ‘average level’. The principle of this is that prices naturally pull back towards a ‘mean’ – if the price gets too far above this average, it’s viewed as too expensive, and traders will sell, driving prices lower. If the price gets too far below this average, it’s viewed as cheap, and traders jump in, driving prices up.
Like an elastic band pulling the price back in.
There are a number of linear regression indicators, but the LR Slope gives a neat on-off reading. If the LR Slope is above zero, we’re in the buying zone. If the LR Slope is below zero, we’re in the selling zone.

We can supplement this with the R-squared indicator, which should be above 0.27 to confirm the strength of the trend (read more about this HERE)
Average Directional Index
The average directional index tells us the strength of a trend. For trend traders, this is a simple reading that’ll help judge if the market really has the legs for our potential trade.
The indicator is wrapped up with two other lines – the directional movement index (one positive and one negative): DI+ and DI-. In an uptrend, the DI+ will be above the DI-. In a downtrend, the DI- will be above the DI+.
So, when we’re looking for zoning tools, here’s how the ADX indicator works …
We want the ADX reading to be greater than 20. If it’s below this level, then the trend just isn’t strong enough …

Trading within the profit zone
Finding the right tool for your trading style may take a little trial and error, but ultimately it will allow you to quickly discount any weaker signals, so you can hone in on the trades that’ll deliver the profits.
Don’t mistake these indicators for trade triggers – these are your trading zone signals, warning you to be on the lookout for trading opportunities. If the price isn’t in your profit zone, you shouldn’t be trading!


JOIN US ...
Get full access to members-only resources, plus my weekly email updates ...
I will NEVER share your details for marketing purposes. Privacy policy
Strategies I'm Using
 It has taken 2 years to persuade this market…
- These videos show how to make 24% gains in…
 As you can see from all the data I've…
 Get the low down on the Heikin Ashi Mountain…





2 comments
Gurnam Singh
could you let us know how many trades you recommend in a week, and have you got any track record how many pipes made in month or year.
thank you very much
gurnam singh
Mark Rose
I really wouldn’t recommend any specific number of trades to take – it really comes down to the trading style and what the market is offering up at that time. I have a mixture of strategies: holding positions for months, for days and for just a few minutes/hours. Obviously, the short-term strategy tends to trade a lot more frequently, while the longer term strategy may only open a couple of trades a month. Rather than focusing on pips made, I’d urge you to think about the style of trading that suits you, and start tracking your progress in the Trading Journal – this is the best way to monitor your progress.