Zone … Trigger … Confirm – 3 steps to accurate trade entries
When we’re
looking for a reliable trading signal, the temptation is to bundle up two or
three indicators – one from the trend basket, one from the momentum basket –
and call that a strategy.
And that’s not a bad way to do things … but we can do so much better if we think about our indicators a bit differently.
I’m going
to put these into three categories – zone indicators, trigger indicators and
confirmation indicators.
1. Zone indicators
The trading
zone is the area that the price needs to be in for us to even consider trading.
These are
really useful tools that tell us to turn on our trading radar. If the price isn’t
in the trading zone, then we should be sitting on our hands, not getting
involved.
If you’re
looking at price action, a trading zone could be a consolidation band … or
bumping against support or resistance. But we’re looking at indicators here,
that’ll do the work of finding a zone for you.
Bollinger
Bands
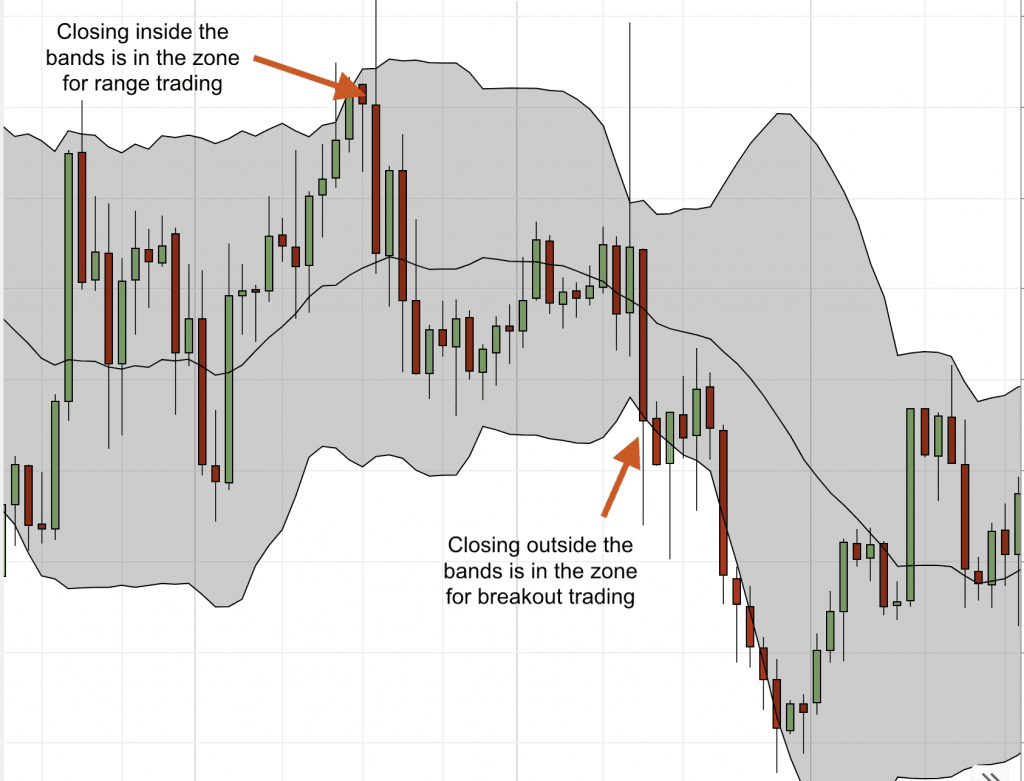
Bollinger bands are really useful tools that combine a moving average with a volatility measure, creating a price ‘channel’. The price can bump along within this range, or it can breakout of the range, which means that Bollinger bands are used by range traders and breakout traders, because we have to distinct zones – inside the bands, or outside the bands.
What’s
crucial here is that interacting with the Bollinger bands is our ‘wake up’
call. The ‘zone’ indicator isn’t giving us a signal – it’s just telling us that
this is where we should be looking for signals.
Moving
Averages
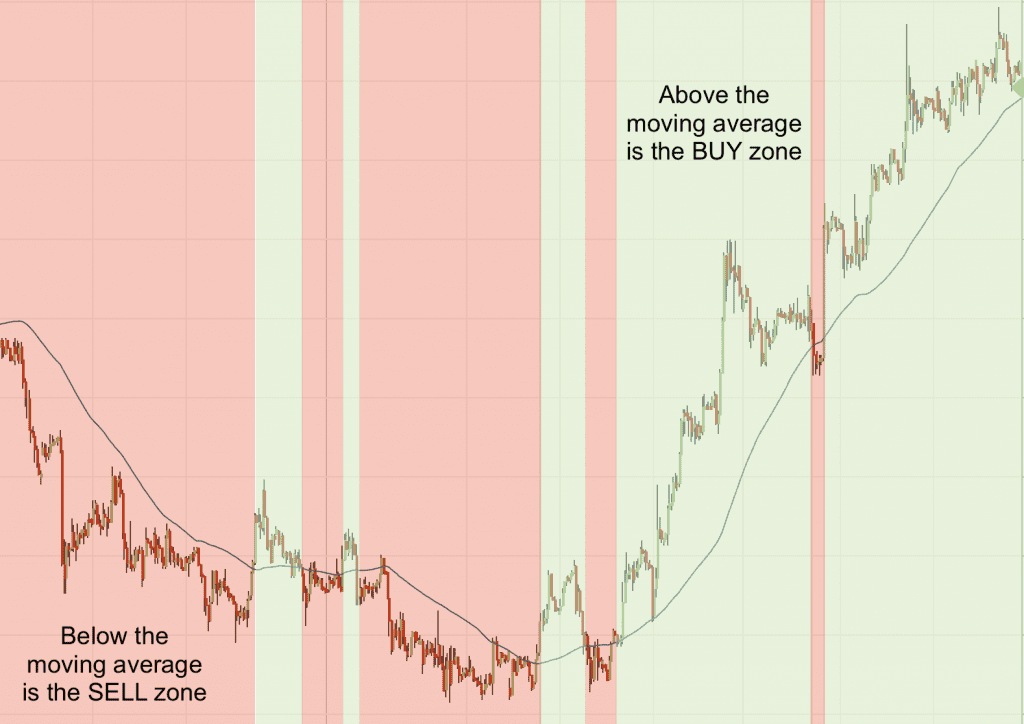
Moving averages often act as areas of support or resistance in trends, so an interaction with an MA line can be an indicator that we’re in the trading zone, looking for a signal to trade.
Moving averages can also give us much wider trading zones, just by being above or below a moving average. If the price is above the moving average, we can be in the ‘buy’ zone; below the moving average, we’re in the ‘sell’ zone.
Ichimoku
clouds
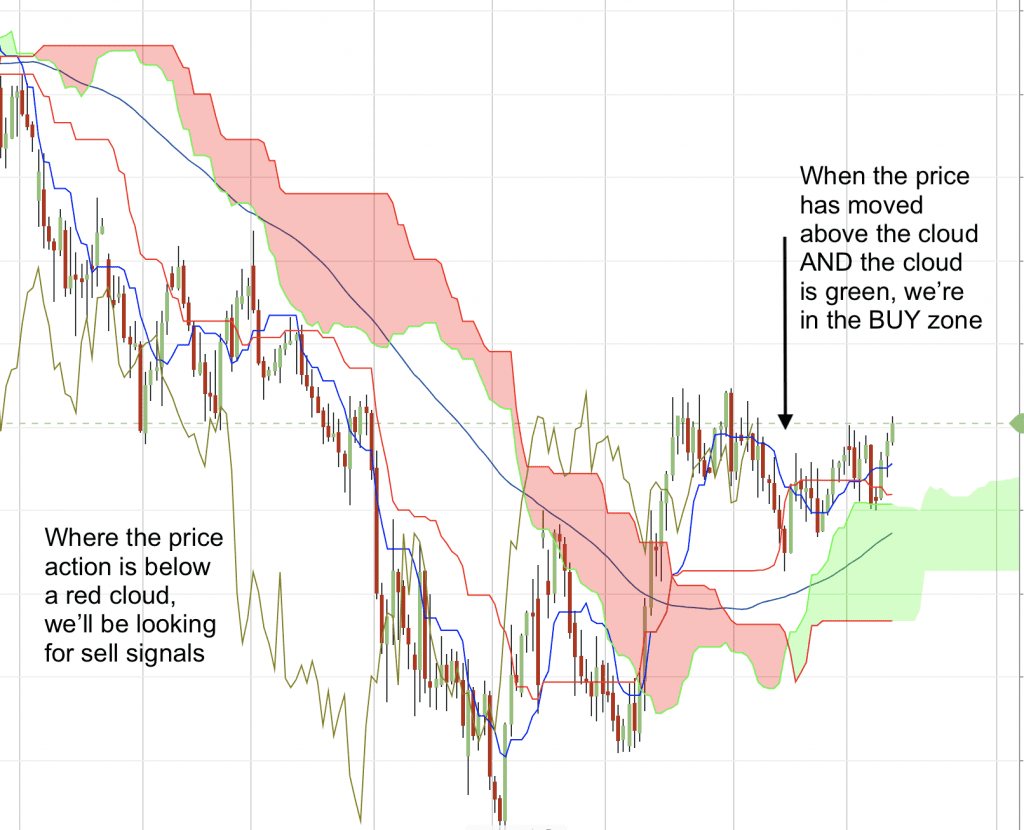
Ichimoku
clouds can be used like the moving average above/below buy/sell zones – but
they’re a bit more sophisticated.
With the Ichimoku indicator, we’ll only look for buy signals if the price is above a green cloud. And we’ll only look for a sell signal if the price is below a red cloud …
The ichimoku indicator can do a lot more than just give zones. If you’d like to find out more about it, please check out this post HERE.
2. Trigger indicators
The trigger
is the signal that tells us now is the moment to hit the buy or sell button. We
already know that the price is in the trading zone – this is the piece of the
jigsaw that says ‘go’.
There are any
number of indicators that can act as a trigger – what’s important is that you
know which indicator is doing this job.
It could be
a moving average crossover …
It could be
a candle closing above or below a key level …
It could be
a bullish or bearish candlestick pattern …
It could be
something linked to your zone indicator – like a close above or below the Bollinger
band.
Whatever
trigger you use, my advice is not to trade off any candlestick that isn’t full
formed – wait for that candle to close. If you want a faster trigger, if
necessary move down to a shorter timeframe – but still demand a fully formed
candlestick.
Here we have a simple moving average crossover trigger, but we need that candlestick to close before the crossover is confirmed …
3. Confirmation indicators
So, you’re
in the trading zone … you’ve got your trade trigger …
That’s not the
end of the story. It’s not even the beginning of your trade.
There’s a
final piece of the jigsaw needed before you hit the button – confirmation.
The nature
of a trigger indicator is that you want a good entry, so it’s likely to be a
jittery signal – one that reacts quickly to price changes, but that’s liable to
false signals.
So, any
trigger needs a confirmation indicator that’ll filter out some of the false
signals (it’ll never get rid of all of them).
When
choosing your confirmation indicator, it’s important to go back to those
original indicator categories – trend, momentum, volume, volatility – and to
pick an area that we’ve not already covered with our zone and trigger
indicators.
So, if your trigger indicator is a moving average, then you might look for confirmation in an RSI …
Confirmation
indicators are often momentum indicators, which can be added as an oscillator
to your chart. However, that doesn’t have to be the case. If your trigger is a
Stochastics crossover, then you might look for a trend confirmation in a MACD.
Building your entry
The
specific indicators I’ve used as examples here are just jumping off points. The
ways in which indicators can be combined are as varied as the ways in which markets
can frustrate us.
What’s
really important is that you know what job each indicator is doing – without
knowing that, you can’t really judge if it’s performing. We should know what’s
telling us we’re in a trading zone … what’s triggering our signal … and what’s
confirming that signal.
By approaching our indicators this way, they’ll work harder for us, be more successful … and ultimately more profitable.