With so much
uncertainty in global markets, wouldn’t it be nice to get a green light on your
trades. Obviously, we can never get 100% certainty in the markets, but 95%
wouldn’t be bad, would it?
I’m talking
about a simple filter you can add to your trades that’ll give them the thumbs
up, or thumbs down – it could be the answer to boosting your success rate.
Here I’ll
show you exactly what this tool is, what it’s telling you – and how to apply
the 95% confidence check to your trades …
Linear regression
Linear
regression is a lot like a moving average, but (arguably) more accurate.
Rather than
being based on an ‘average’ price, it’s about drawing the ‘best fit’ line
through price points.
Something like this …
And the
linear regression indicator plots this route across our charts.
The result looks a lot like a moving average, but gives a more accurate picture of price levels and is more sensitive to changes.
But that’s
not the indicator we’ll be using – we’re looking at two offshoots from this
indicator.
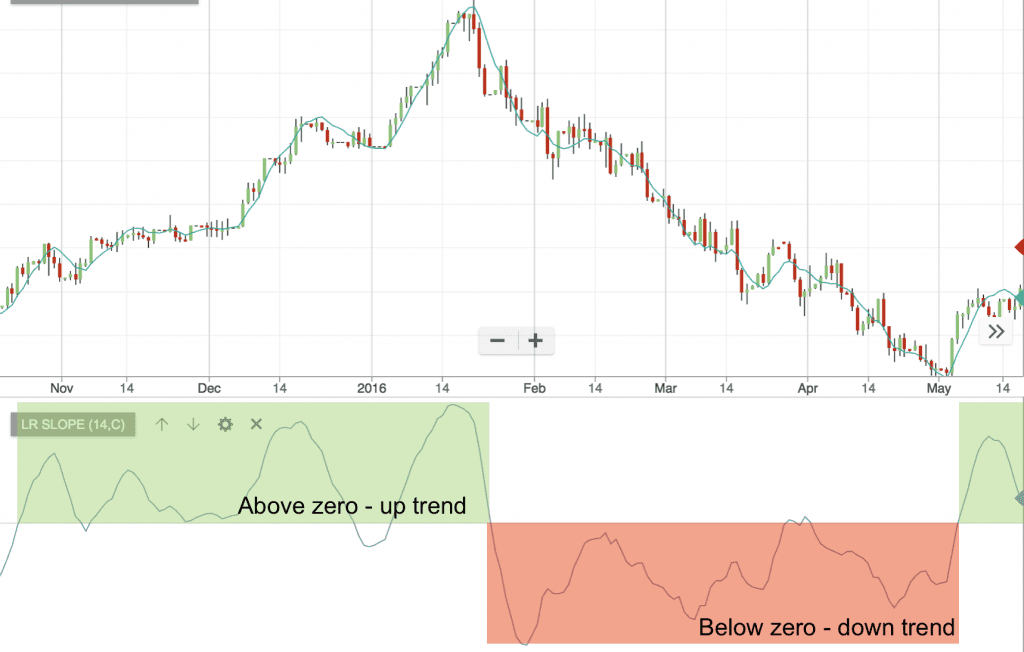
The first is the Linear Regression Slope
This is a measure of how fast the linear regression line is moving – i.e. the angle of our slope. If the angle is steeply upwards, we’ll get a high figure. If the angle is steeply downwards, we’ll get a negative number; and if the linear regression line is flat, we’ll get zero on the slope.
This is a
useful tool and will tell us when the trend changes direction – along with
which direction it’s moving in.
But it’s the second piece that gives us that 95% check
The
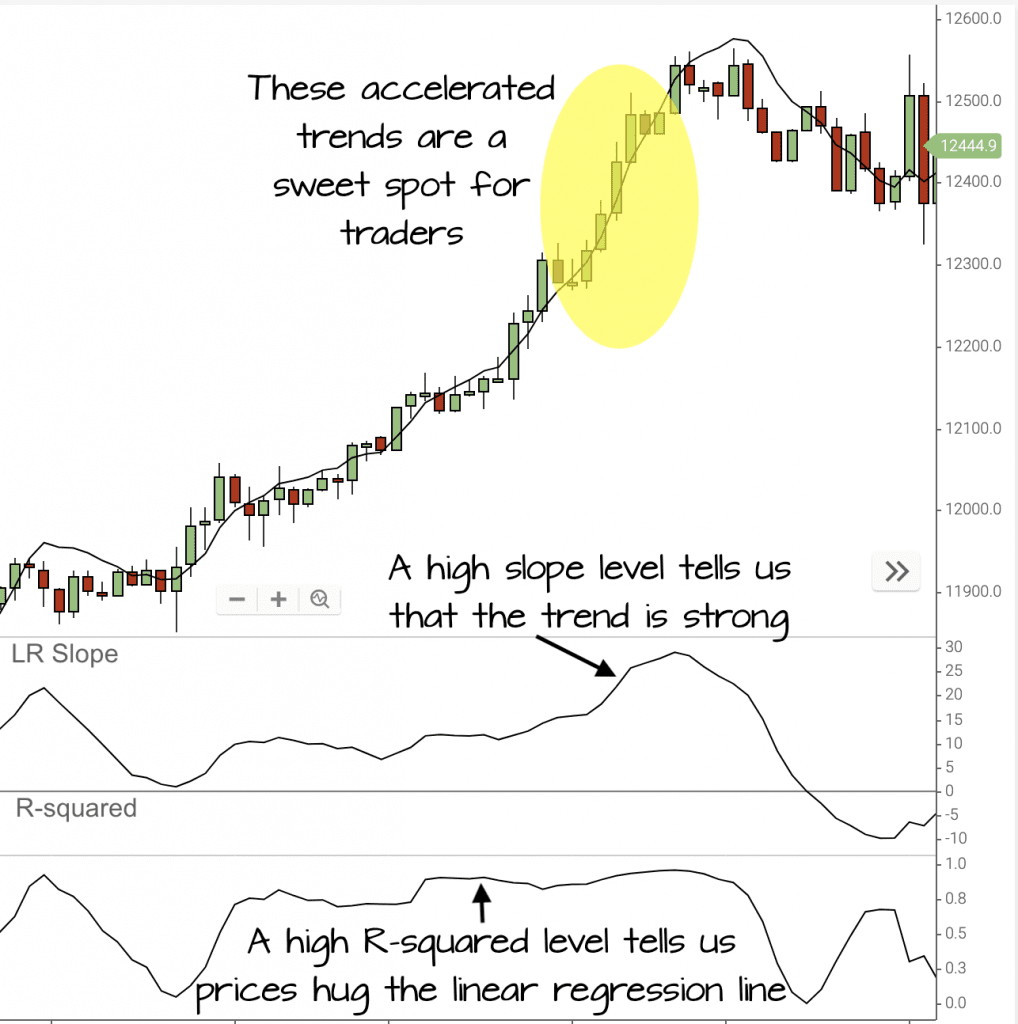
R-Squared indicator tells us how far the price has moved away from the linear
regression line. It’s measured as 0–1, or as a percentage, from 0–100%. The
closer it is to 1 (or 100%), the closer the price is to hugging that linear
regression line.
The ideal for us traders is when we’re in a trend with a large linear regression slope (ie the trend line is steep) AND we’ve a high R-squared, telling us that the price is close to the linear regression line.
How to apply the 95% check
So far
we’ve looked at what’s behind the R-squared indicator and what exactly it’s
telling us.
But you
don’t really need all that background info to run the test – you just need to
run this check on your trades …
First off,
check the trend on the LR slope – this’ll confirm your direction.
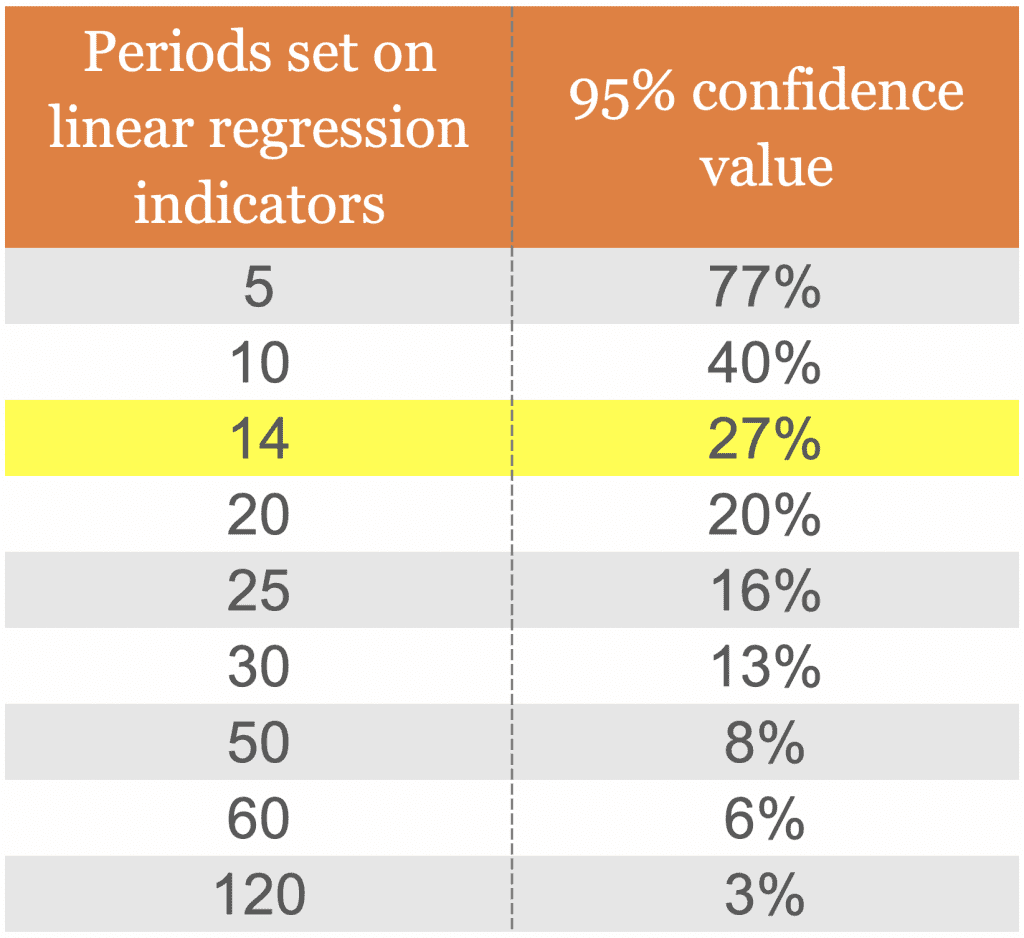
Second, read off your R-squared level, and check it against this chart …
The default
setting for linear regression tools is 14, so the crucial figure to be reading
off our charts is 27%, or 0.27.
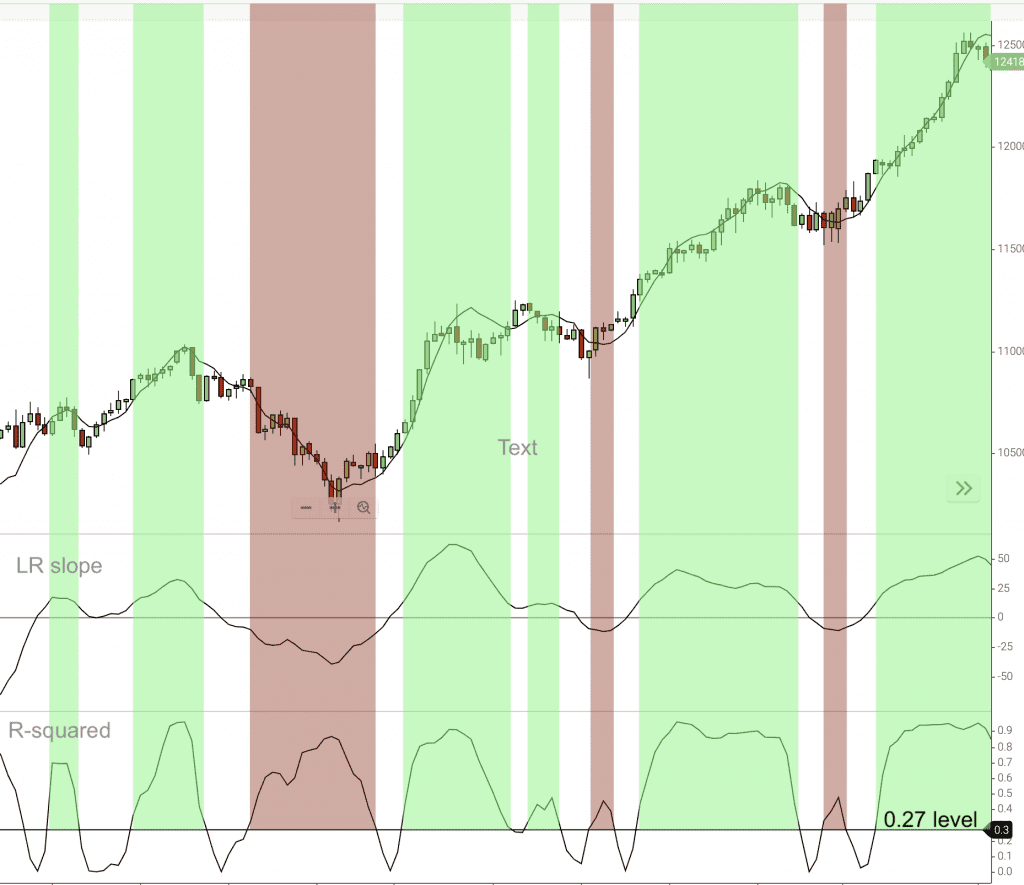
Here are some examples to show it in action …
On the
chart above, I’ve marked in green the areas where the linear regression slope
is above zero AND the R-squared reading is above 0.27.
I’ve marked
in red where the linear regression slope is below zero AND the R-squared
reading is above 0.27.
It’s worth
remembering that this is not a signal to trade – this is a filter, which
tells us that we should only be looking for buy signals in the green zone, and
sell signals in the red zone.
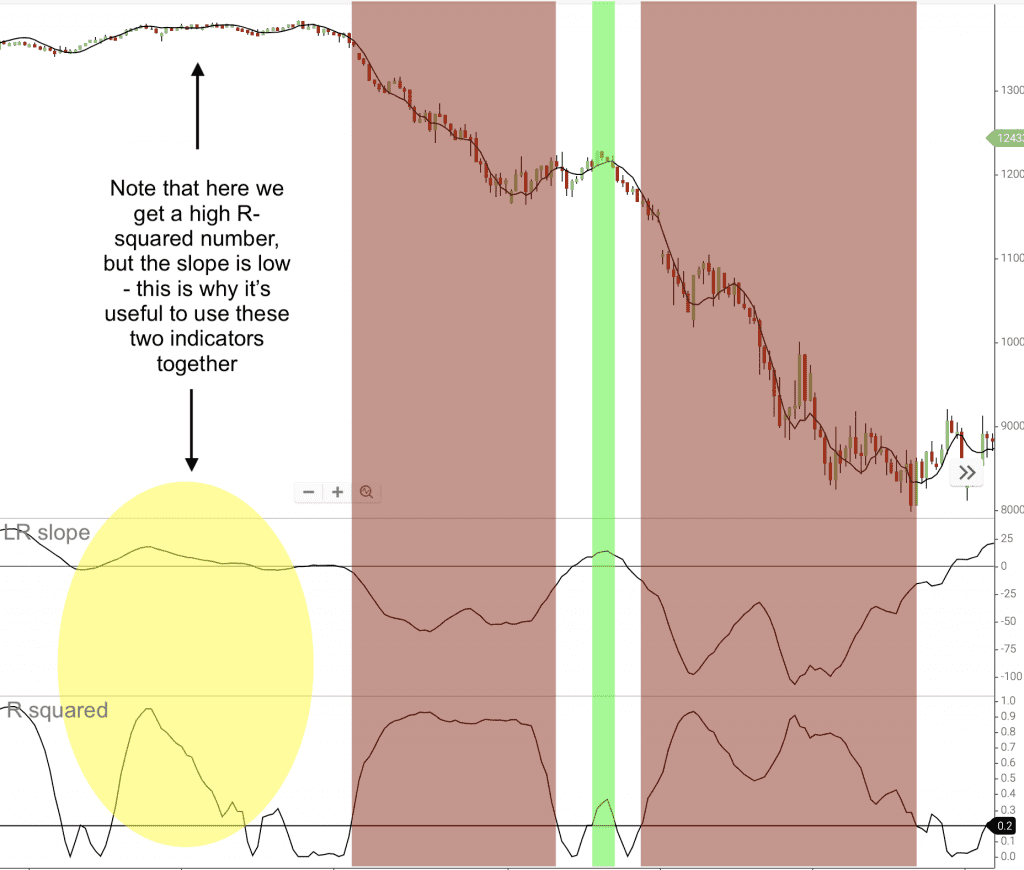
In this next example, I’ve increased the period setting on the indicators to 20 – I find that 14 can be very jumpy. Therefore, the cutoff level for the R-squared 95% check is 0.20.
This shows
why it’s good to use the R-squared indicator in combination with the linear
regression slope. In the example above, we’ve got a prolonged sideways period –
the price is nicely aligned with the linear regression line, but it’s not
trending.
Again, I’ll
reiterate – this is an extra filter to give greater certainty to your
trading signals. I recommend you try adding it your charts to see what effect
it would have on your success rate.
Thank you for your well written article and great use of screen captures for examples.
In regards to the percent certainty you set, is it irrespective of time frames?
For example, your 0.27% is set for 14 period time frame.
Does it matter if that 14-period is on a daily chart? 1-minute chart? Or somewhere in between like a 4-hour or 30-miute chart?
Or do all your percentage of certainty settings assume one time frame?
Thanks for your message and feedback. That table should apply across any timeframe. I’d be interested to see how it performs in longer and shorter term trading and across different markets. I expect this tool will be more successful in Forex than stocks as they have a natural tendency to the revert to the mean.
Hi Paul, I haven’t applied these on my MT4 account as yet – although it’s on my to-do list (knee deep in Bread & Butter indicators at present!).
I notice there are a couple of indicators posted here (https://www.mql5.com/en/code/127 and https://www.mql5.com/en/code/7244) – I’ve not tried or tested either, so can’t vouch for it. I’d be interested to know how you get on.
Ok thanks. Just been using it for 100 pip target on the DOW. Thanks so much posting looks like it will also save me from lots of bad trades in range. A great and useful post many thanks
Hi Rori, I’m afraid I added the colours in myself manually – just to demonstrate the ‘buy’ and ‘sell’ zones. The indicators just give you the two oscillators at the bottom of the screen. Best of luck with testing this out – I look forward to hearing how you get on.











8 comments
Johnny Boy
HI there:
Thank you for your well written article and great use of screen captures for examples.
In regards to the percent certainty you set, is it irrespective of time frames?
For example, your 0.27% is set for 14 period time frame.
Does it matter if that 14-period is on a daily chart? 1-minute chart? Or somewhere in between like a 4-hour or 30-miute chart?
Or do all your percentage of certainty settings assume one time frame?
Thank you.
Mark Rose
Thanks for your message and feedback. That table should apply across any timeframe. I’d be interested to see how it performs in longer and shorter term trading and across different markets. I expect this tool will be more successful in Forex than stocks as they have a natural tendency to the revert to the mean.
paul
Hi Mark,
Thanks for your reply. I’m still using MT4, so not sure I can make use of those mql5 code.
I did look for MT4 equivalent but a bit of a challenge. Found this but, like you, not got round to testing.
https://www.perfecttrendsystem.com/blog_mt4_4/en/linear-regression-indicator-indicator-for-mt4
I’m still persevering with my own slant of PIE.
Mark Rose
Hi Paul, I haven’t applied these on my MT4 account as yet – although it’s on my to-do list (knee deep in Bread & Butter indicators at present!).
I notice there are a couple of indicators posted here (https://www.mql5.com/en/code/127 and https://www.mql5.com/en/code/7244) – I’ve not tried or tested either, so can’t vouch for it. I’d be interested to know how you get on.
Paul
HI Mark,
Where can I source these indicators from (for use on MT4)?
Doesn’t appear as standard indicators
Thx
Rori
Ok thanks. Just been using it for 100 pip target on the DOW. Thanks so much posting looks like it will also save me from lots of bad trades in range. A great and useful post many thanks
Mark Rose
Hi Rori, I’m afraid I added the colours in myself manually – just to demonstrate the ‘buy’ and ‘sell’ zones. The indicators just give you the two oscillators at the bottom of the screen. Best of luck with testing this out – I look forward to hearing how you get on.
Rori
Where can I find these that also can couloir the chart like your pictures? Will be testing this out thanks