July 11, 2014by Mark Rose- 1 comment
How the volatility index can turn your account into a slasher movie
You know that quiet bit in a horror movie, when the thunder stops crashing and our ears are straining to hear something … usually just before the pretty girl gets her throat cut?
Well, a lot of commentators have been comparing current market conditions to that scene. Are they right?
The warnings relate to the Volatility Index or Fear Index. It’s been giving very ‘low fear’ readings, which, as anyone who’s ever watched a horror movie will know … is just when the killer chooses to strike.
It’s been a while since I talked about the Volatility Index here. So I should start with a quick recap on what it is and how it works … here’s the maths …

Any clearer?
I’m just kidding. We don’t need to understand the maths behind the Fear Index to get what it means.
It’s more commonly known as the VIX, and less commonly as the CBOE Market Volatility Index.
The VIX was first established in 1993, and it is calculated on a weighted blend of prices for a range of options on the S&P calls and puts. Like I said, we don’t need to worry about the actual calculation, but the gist is that traders will buy put options as insurance when they are worried about market conditions. When lots of traders are worried, the price of these put options goes up – and the VIX level measures this. So, in essence, it is a gauge of investors’ confidence in the market.
The VIX, in general, has an inverse relationship to the market. The VIX goes up as stocks decline, and the VIX declines as stocks advance. A low VIX means that traders are confident about market conditions. A high VIX means that they are fearful.
This chart shows how the two instruments correlate to each other …
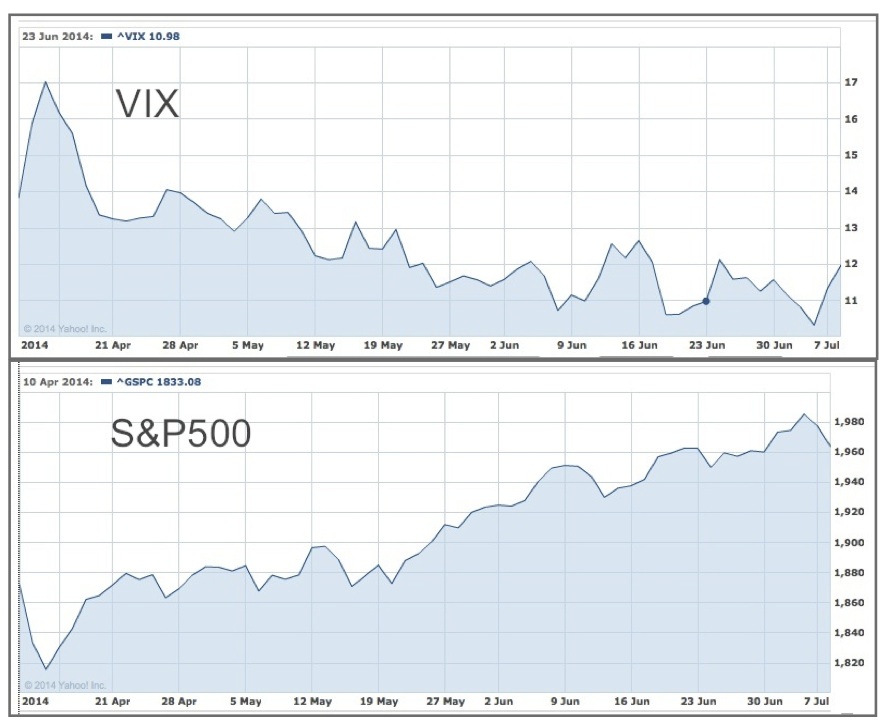
As you can see, when the VIX spikes up … the S&P spikes down.
What makes the VIX special is that it claims to have predictive powers, measuring expected volatility over the coming 30 days.
But what’s been going on with the VIX that has got so many commentators worried?
Since the end of April, the VIX levels have been dropping sharply, hitting a multi-year low last Thursday, which got lots of traders hot under the collar.
Isn’t low risk a good thing?
Well, the problem with quiet, complacent markets is that there’s only one direction to go in … increased risk, and falling prices. (That’s the moment the killer suddenly appears at the window.)
So, how serious is this problem?
Some traders will tell you that these levels match the VIX pre-crash levels of 2007 and that means the current bull run is about to crash … the sky will fall in … the lights will go out … and world order will tumble … zombies will be roaming the streets …
But there are a few other factors to bear in mind …
- Last Thursday’s very low reading was a slight anomaly due to the long 4th July weekend (a 3-day weekend always upsets the calculations slightly, giving an abnormally low reading).But, even taking this into account, we’ve still spent much of the last two months with readings below 12 – something we haven’t experienced since 2006.
- While the chart we saw above clearly shows that when the VIX spikes one way, the market spikes in the opposite direction, it’s misleading to think that a low VIX equals a high S&P, or vice versa. If we look at the two charts over a longer timeframe, I think you can see that the correlation between the two isn’t that simplistic.
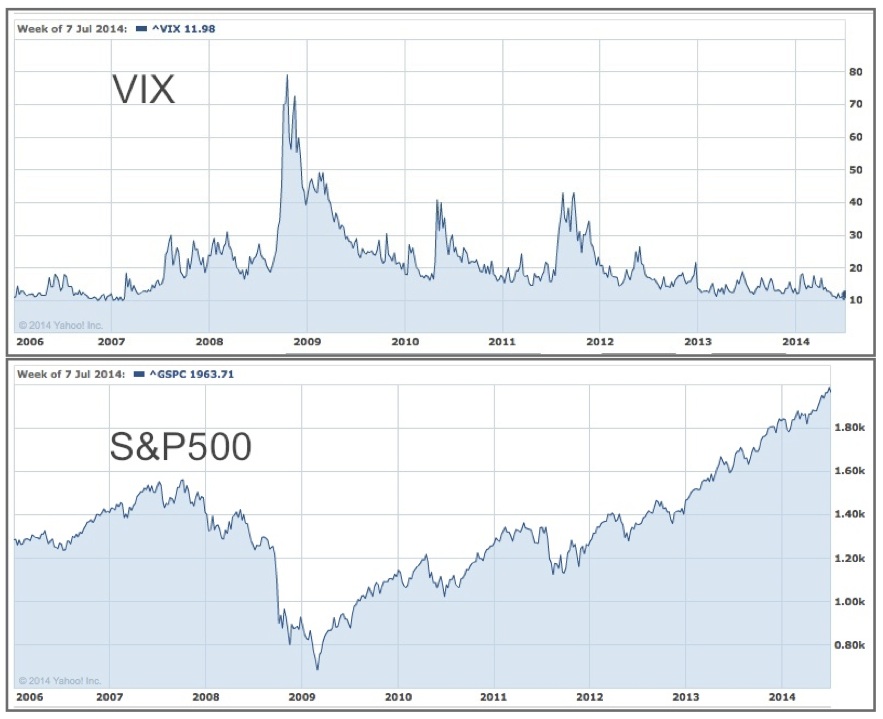
While the spikes in the VIX tend to be followed by a sell-off, the general market direction isn’t driven by the VIX. In fact, the VIX can happily trundle along at a low level for extended periods – everyone’s very happy.
So we can stop worrying about the VIX, right?
Well, we shouldn’t have an impending sense of doom, but it’s a good idea to watch the VIX’s direction (as opposed to the VIX’s level).
If the VIX looks like it’s heading sharply upwards, we can expect to see a correction on share prices. For the first half of this week, we’ve seen an upward correction from the low last Thursday, but yesterday saw the VIX shoot up again. We should be keeping an eye on this.
And if the VIX continues to rumble along at a low level?
Then we should think about what Dr Minsky had to say about stable markets …
Back in 1992, economist Hyman Minsky wrote a paper on what he called his “Financial Instability Hypothesis”. The theory was that stability leads to instability – stable markets make investors complacent. They increase debts … they postpone savings … they don’t concern themselves with pensions …. And the result of this is that when some instability comes into the market, we see a violent correction.
Minsky’s paper was largely ignored until the crash of 2008, when suddenly, after the event, everyone saw the wisdom of his hypothesis.
In short, we should be mindful of VIX levels and we should guard against complacency, using good trading tools, like well positioned stops and hedges. But we don’t yet need to run, screaming for the hills.








1 comment
Ed
As we are only basically betting on which direction an asset will go, as against holding share certificates, why should WE worry and run for the hills ? If we are on the wrong side of any sudden dramatic move, that will immediately become obvious, so we cut and run with it – right ? A time to make some REAL money.