August 26, 2016by Mark Rose- 1 comment
Investment risk: beware thin ice
I hate to be the voice of doom, but if you’re lucky enough to have a bit of cash to invest … well, that cash could be a poisoned chalice.
Inflation is heading upwards … and interest rates are falling … which means that the cost of living is going up, and returns on our capital can’t keep up.
Bank of England data shows the average easy-access savings rate is at an all-time low of 0.34%, while inflation is at 0.6%, and widely expected to be at 2% within a year.
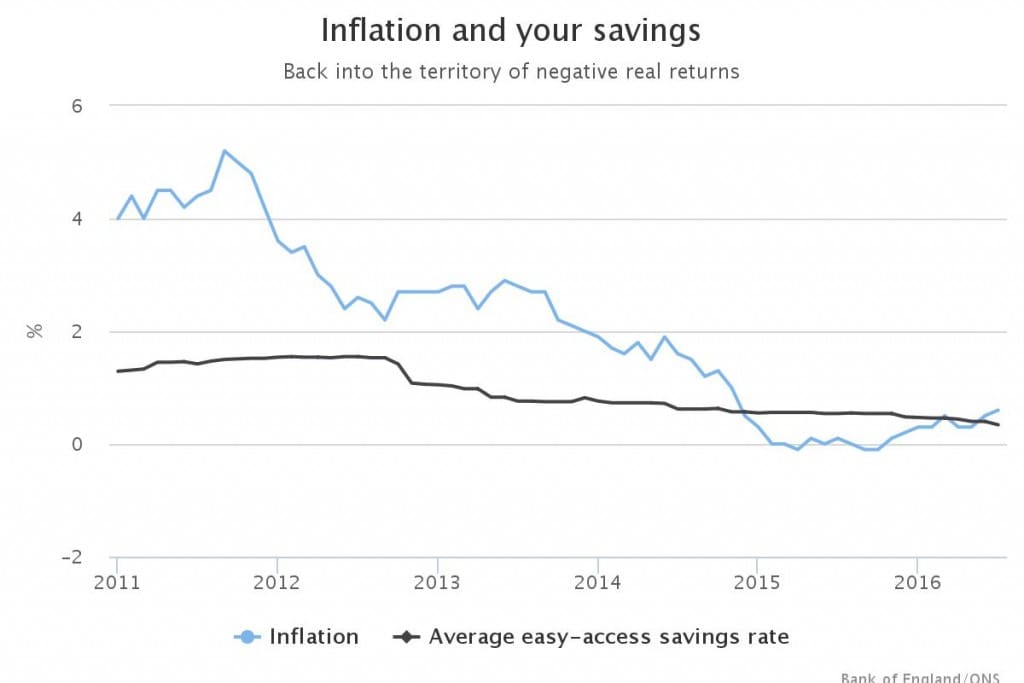
What it means is that – if you do nothing – you’re going to get poorer.
The good news is, that as a reader of Trader’s Bulletin, you’ve already moved ahead of the crowd, as it means you’re interested in finding better ways to put your money to work. And I’ve important information on exactly that …
Beware thin ice
This month, Tobias Rötheli, of the University of Erfurt in Germany published a paper about fishing on a frozen lake.
His subjects play a computer game where they can choose where to fish on the frozen lake. The further they are from the shore, the more fish they catch, but the greater the chance of the ice breaking – which will cause everyone to lose their fish.
It’s easy to see the parallel with trading – the greater the risk, the greater the potential reward, but also the greater the risk of losing it all.
But what Rötheli then did was change the ‘interest rates’ on his fish … he made the returns on safer fishing spots smaller – increasing the steepness of the risk-reward profile.
The result was that his virtual fishermen went further and further out on the ice, seeking better returns and taking bigger risks. And, as the returns on ‘safe’ fishing dwindled, more and more fishermen crashed through the ice, losing their whole catch.
The lesson for us?
Low interest rates put us at direct threat of taking risky investments that will lead us to crash and burn.
So now is a moment to act – because doing nothing will leave us worse off. But it’s also a time to avoid being drawn into high-risk investments.
If you want to earn more than the paltry 0.34% that a savings fund might offer you, there’s no shortage of investments offering you returns of 10 times, 100 times, or even 1,000 times better than that. But before you let your head be turned by a returns figure, look really hard at the risk.
Reading between the profit and loss lines
A high return on investment is always going to be tempting, but if the risks on that investment are too great, you’re unlikely to get to enjoy those returns because you’ll have burned up your funds on the way.
Of course, it’s easy to find the ‘bottom line’ on a trading method – what kind of return it’s produced in the last month, the last year … but how do we measure the risks it’s taken to achieve that? Risk is tough to measure, which is why it’s easy to overlook or gloss over.
But here are 4 key factors to look at that will give you a picture of risk on any trading method …
I’m always banging on about risk-reward profiles – and how they tell us nothing about profitability. The risk-reward of a trading strategy just tells us how much we risk on average, and how much we win on average – it doesn’t tell us how often we make those wins, or how often we take losses.
There is no ‘bad’ risk-reward profile. You could be risking £100 to make £10 – provided you win often enough, it can be profitable. However, I would warn against any extremes of risk-reward, as they tend to go hand-in-hand with volatile returns.
Just as a risk-reward profiles on their own don’t tell us anything about profitability, neither does the success rate. This figure tell us how often we can expect to win, and how often we can expect to lose – but give no information about the size of those wins or losses.
Again, it’s extremes that take us into danger territory here. If you’re only winning a small percentage of your trades, you’ll have to suffer very long losing runs. Take a system with a win rate of just 30% – you could expect to get a run of 13 losing trades in a row in every 100 trades.
Likewise, a very high success rate will likely have large losses offset by lots of small winners. And – as losses don’t tend to fall in nice even patterns – if a few of these come together in a run, you’ll be looking at a very nasty drawdown.
-
Drawdowns and volatile returns
Some of the most profitable trading methods on the planet have the kind of drawdowns that would make your eyes water and your nose bleed. They might make 500% one year, and then give back 80% of it the next year.
Most of us don’t have the resources or the nerve for those kinds of drawdowns. They can easily wipe out a trading fund before it’s had a chance to build up any profits.
Look for a trading system that doesn’t have large drawdowns – no profit curves move in perfect straight lines, but we want as smooth a curve as possible, rather than one that bumps up and down.
None of the factors above will count for much without a decent period of testing. Between 100 and 200 trades will give you a picture of what your average risk-reward and success rate look like.
The longer you test, the more periods of drawdown you’ll experience, so this will give you a better picture of what kind of losses you’ll be up against. It’ll also show you the system performing across different market conditions – how has it fared in periods of high/low volatility? In trends? In range-bound markets?
Knowing these things about a system will mean you’re prepared for the ups and downs – how big they’ll be and how often you can expect them (of course, markets will never perfectly match our probability stats!)
Remember that risk is a key part of any trading system – it’s the unpredictability of returns that allows us to make money in the markets. Risk doesn’t have to be your enemy. Many investors are nervous of risk and take a ‘head in the sand’ approach – but if you look at the risks hard, you don’t need to over-stretch yourself financially and you can avoid any nasty surprises down the road.
Over the coming weeks I’ve some fantastic opportunities – these are systems where the focus is on risk management, rather than just flashing big numbers at you! Please watch out for more details.
Save
Save
Save
Save
Save
Save









1 comment
Laurie
Thanks for another very interesting idea Mark.
I just tried it on the 5 min chart and it was a winner 🙂
I feel that a higher time frame would be easier to manage though. Do you have a favourite time frame for this strategy?
Also is the stop 5 pips away PLUS the spread on top of that?
Could this be incorporated into Diff Code in any way do you think?