December 10, 2010by Mark Rose- 0 comments
Gold: are the big boys in or out?

Last week I promised you access to a report on gold prices, fresh from the desk of one of the City’s top hedge-fund analysts.
Well, this week – true to my word – it’s ready for you to read. I think you’ll be rather surprised by the view that “big money” is taking. Before I give you the link, a few words on why I think that this opinion is worth listening.
There’s no shortage of “opinions” on gold – check out the media, talk to most investors – they’ve all got a view on whether gold is a “buy” or a “sell”.
The one thing there’s no doubt about is how much money people have made from gold in recent years. The bull run it’s enjoyed has been phenomenal.
But for every investor who’s rubbing his hands in glee at the profits he’s accumulated – there are 100 other investors who are grumbling because they missed out on these profits.
Whether you’re one of the traders who’s made a killing in precious metals, or whether you feel that this one has passed you by – this gold report will make compelling reading.
Click here to find out more.
As I mentioned last week, it’s not easy to get a view on gold that isn’t biased – many of the pundits who are talking up gold, are up to their necks in the yellow stuff in their portfolios – so they’ve a vested interest in getting you to buy gold.
What you need to know is whether the big money is moving in or out of gold.
And this is where you can find out.
This report is a timely reminder that profitable trading is as much about avoiding losses as it is about making gains.
Following a trend is all well and good, but when that trend ventures into the rarified air of ever higher new peaks – the trader is in treacherous territory.
Traders can reap great rewards in this uncharted territory. Prices at new highs possess a momentum that ignite further sharp price moves. But these dynamic breakouts can also demonstrate very unexpected behavior. Old battlegrounds of support and resistance disappear, while few reference points remain to guide entry and exit levels.
In this volatile environment, risk escalates with each promising setup.
And what does the herd usually do in this environment? Well, almost without fail, they jump in at the top with both feet!
*How to spot a price topping out*
So, how can we be smart, and recognize a market top or bottom?
The simple truth is – I’m sorry to say – that we can’t. And for that reason, we need to be cautious.
Tops and bottoms are notoriously hard to pinpoint. And, in my opinion, tops are even harder to pin down than bottoms.
Markets tend to bottom out after a run of panic selling, in which investors dump the asset in question, and then, with the impulse to sell having been exhausted, they suddenly rush in to snap up the bargains and cover their short positions.
For this reason, we might see a “V” shape at the bottom of a bear market, where a 90% downside day is followed by a 90% upside day.
It would be convenient if the top of a bull market looked the same, just flipped on its head. Unfortunately, things aren’t that simple. The final days of a bull market are substantially different to the final days of a bear market – just as the psychology that drives these reversals is different.
A bear market low is characterized by fear and panic.
A bull market high, by contrast, is characterized by greed and complacency. And anyone who’s ever watched the gains they’ve made in a steady bull market rapidly disappear in the subsequent bear market, will know the importance of keeping on your guard.
Market tops can be slow-building affairs. And the familiar trend-change patterns that we look for (like a double top or head and shoulders) take a long time to develop – which can leave the trader significantly out of pocket by the time he or she has recognized the reversal pattern.
**A very bad sign**
One pattern that perfectly illustrates the slow decline of a bull market into a bear market is the descending triangle. It shows the psychological process of the momentum draining away from a dynamic uptrend.
Here’s one in late 2007 on the Hang Seng index:
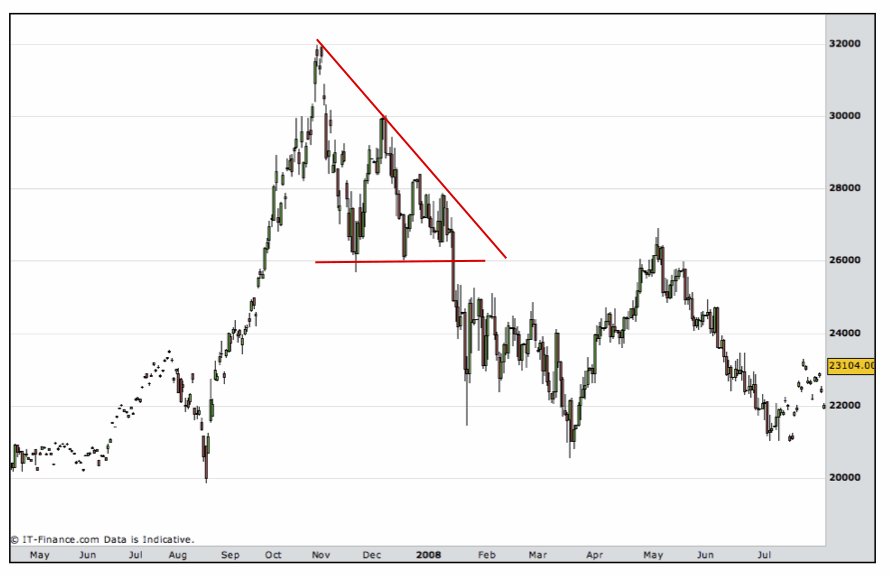
Here we see the shock and fear of the first price fall quickly followed by “true believers” coming back into the market looking for their profits to return. This gives the price a firm bounce – confirming to those bulls that they were “right all along”. However, some smarter investors will see this rally as their opportunity to get out – so it doesn’t reach the previous highs – as they exit, the price reverses downwards again.
Each time the price criss-crosses up and down, investors are jumping ship. As the price range narrows, the Bollinger bands will be closing in – until even the bulls are forced to accept the inevitable.
So, watch out for descending triangles on gold, and – if you haven’t already – download the Chariot Capital Gold Report now, to ensure that you keep a step ahead of the herd.
Until next week,
Mark Rose