Today we’re going to embrace the positives of being stuck between a rock and a hard place, and we’re going to take a profit by repeatedly bumping up between the two.
Support & Resistance
Support
and resistance are nothing more complicated than price areas a stock, index,
currency (whatever you’re trading) struggles to move through.
As the
price moves up, sellers come in and halt its progress … as the price moves
down, buyers come into the market and give it a boost.
These
magic support and resistance areas appear all over our trading charts – and are
among the most useful and widely applied tools in the trader’s repertoire.
This is a look at a USD/CAD chart from last week …
The
currency pair is stuck in a trading range between around 1.3400 and 13440. And
by simply drawing two horizontal support and resistance levels on this chart
show, we can demonstrate just how much profit potential this scenario presents.
This
isn’t a one-off move between the two levels, but multiple opportunities, as it
bounces back and forth.
Drawing lines
There
are a couple of useful tricks I find helpful when drawing in support and
resistance lines …
The
first is to use a line chart rather than a candlestick chart – this is
especially beneficial for longer time frames. By only showing the closing
prices, this cuts out some of the knee-jerk spikes you find in candlestick
charts.
The
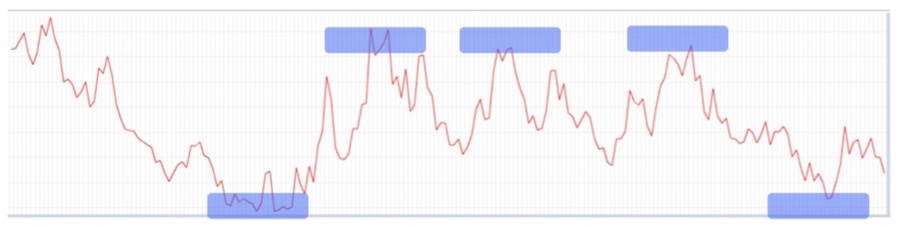
second is to think of support and resistance levels as “areas” rather than
“lines”.
Take a look at this image of a price chart, with the support and resistance areas highlighted in blue:
This
can be more practical than hopelessly trying to join up peaks and troughs with
a ruler.
So, I’ve
drawn a channel on my chart … all that remains is for me play forex “ping pong”
between these two levels – buying when we’re at the bottom of the range and
selling when we’re at the top.
Right?
Well,
not exactly.
Where to place stop levels
If I’m
going to use these support and resistance levels for entry and exits, I need to
consider the thousands of other forex traders who’ve had exactly the same great
idea as me …
Much
as I like to think I’m special … it’s unlikely that no one else has noticed a
price moving in a range.
All
this traffic means that prices will inevitably get a little “messy” around
these support and resistance areas. For that reason, we need to give our trade
some room to breathe, with stop losses outside the channel.
Again,
I find that thinking of the support and resistance “zones” helps me to avoid
the common pitfalls of setting my stops where they can be too easily knocked,
and my profit targets just out of reach.
Where to place targets?
You’ll
notice that prices don’t always bounce neatly between our two levels. Sometimes
the move only makes it halfway, before retracing.
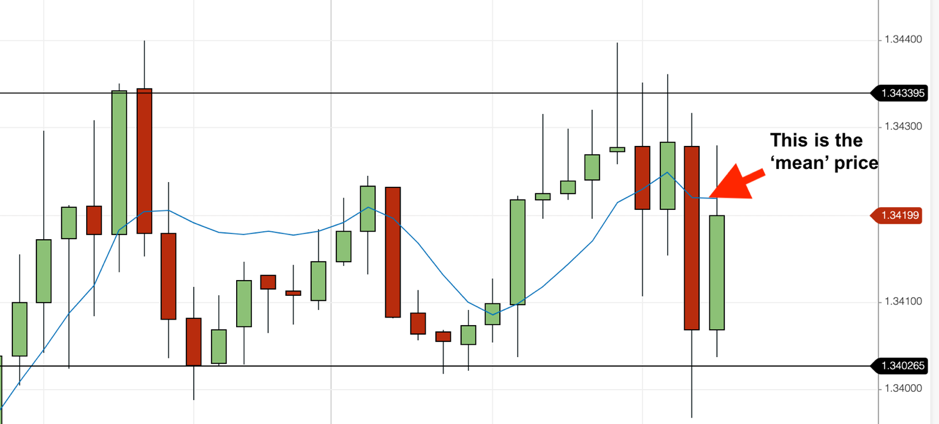
Looking at that USDCAD chart again … you’ll notice a blue line running through the middle of the price action, that looks a lot like a moving average …
This
blue line is actually a Linear Regression Forecast line – an average level that
we can ‘expect’ (in that we can expect the price to do anything!) the price to
revert to.
These ‘forecast’ lines claim to have
stronger predictive powers than a moving average
So, it
can be worth using more than one of them, in a crossover strategy, a bit like
you would for a moving average.
In this image below, rather than drawing S&R lines, I’m using a technical indicator channel (more on these another time), along with two Linear Regression Forecast lines – one fast, one slow …
What I’m
looking for is a breach of my channel, closely followed by a Linear Regression
crossover to confirm the move.
As long as
the price hasn’t already moved to far – we can get a great ping-pong set up
here, with clear stop levels outside the channel and some good market moves as
the price ‘reverts to mean’.
I’m hoping to bring you much more on this kind of trading soon.













1 comment
Howard
Hello Mark
Where do you get linear regression indicator from?
Thanks
Howard