

Where to take profit: 3 intelligent exit strategies
‘Managing’ our trade exits often gives traders the heebie jeebies.
Why?
Because once we’re in a trade, it all becomes a bit emotive … it’s winning, so should we snatch those profits … it’s losing, so should we hold tight and wait for it to come good …?
It’s not hard to see why the fingers-in-ears method of trade management has become so popular!
But these 3 simple tools will enable you to manage and exit your trade intelligently and rationally, knowing where to take profit and where to cut losses … no emotions … no cold sweats …
Exit strategy 1: PSAR
As an indicator, the PSAR looks a little different from our usual lines and oscillators. Instead it’s plotted as a series of dots. If the dots are above the price, it’s a bearish sign; if they’re below the price, it’s bullish.
But many traders use these dots to tell them where to place their stop orders.
Yep, intelligent exits aren’t just about positioning a profit target “x” number of points away from your entry – it’s also about where your stop is. And that’s for two reasons – let’s face it, some of our exits will be negative ones (we need to be prepared for that) … and secondly, this kind of intelligent stop moves with the price, and should give you a profitable exit.
This is an excellent way to use dynamic stop losses with a trend-following system, because – while the trend is underway – the PSAR will follow the price up, or down, allowing the trader to tighten their stop, and ultimately to lock in profits, by adjusting their stop level.
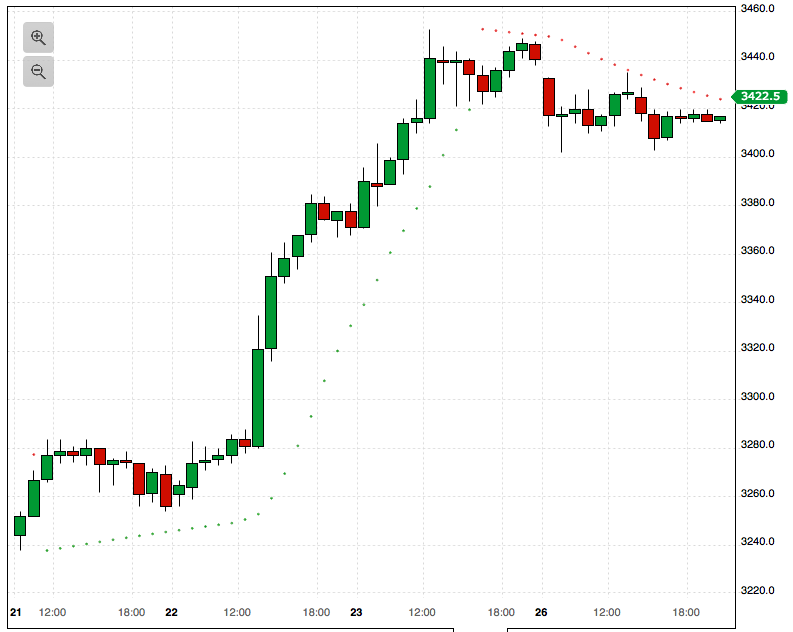
You can see in the image how the PSAR dots follow the trending price, a ‘safe’ distance away. By using the PSAR to guide where you put your stop loss, you can apply an ‘intelligent’ trailing stop – one that follows the price up, and once you’re sufficiently in profit, begins to lock those winnings in.
Exit strategy 2: Fibonacci
The PSAR is a good option for a trend-following strategy, but Fibonacci levels will give you good exit guides in a wider range of market conditions.
I don’t want to get into the whys and technical details of Fibonacci here – we just want to use this trick to give us a good exit.
The Fibonacci principle is that prices move in patterns that match the following percentages: 38.2%, 50% and 61.8%.
So, if we’re trading a retracement between a recent high and low – we want to take profits when the price has hit one of these percentages. Here’s an example, where we’ve entered a buy trade, where the price is pulling back from B towards A … but where should we take profits …?
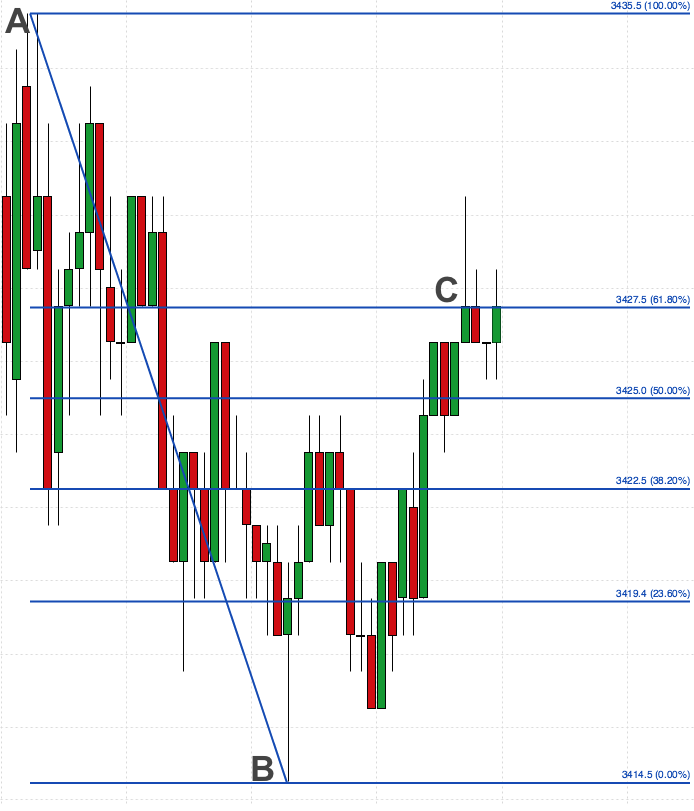
The Fibonacci retracement levels show key levels where the price could turn back – these are where we should be taking profits, so by the time the price has reached C, we should be out of this trade.
Applying Fibonacci levels to charts used to be a fiddly process, but now spread-bet platforms offer a simple drag-and-drop option that allows you to draw them in place at a click of a mouse.
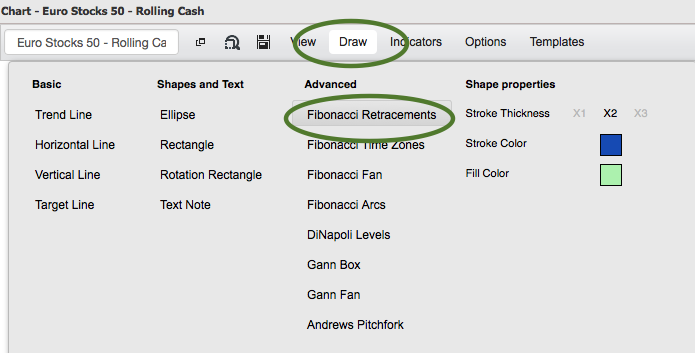
I can then just click and drag the indicator between a recent high and low …
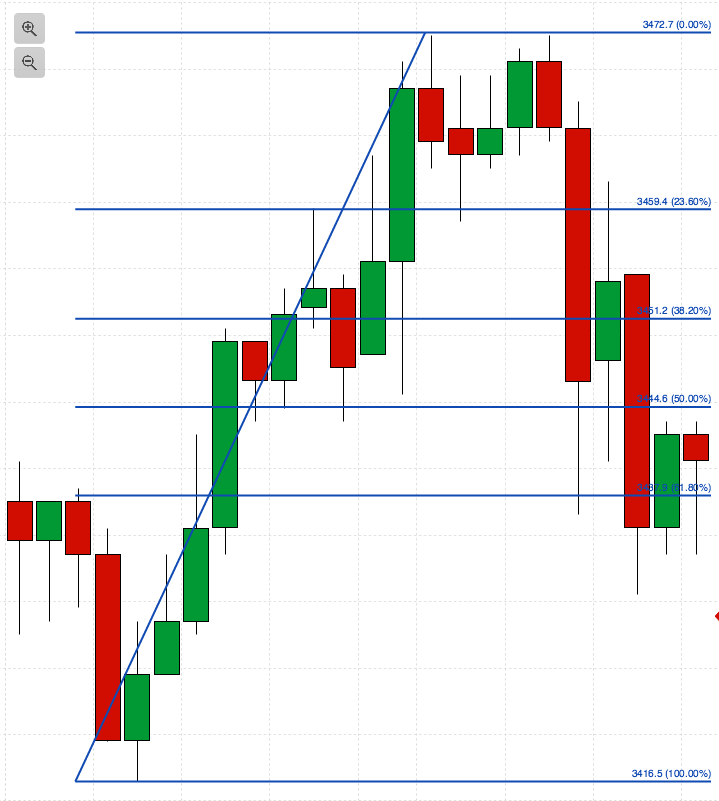
Exit strategy 3: Average True Range
Fibonacci levels work best in longer timeframes. For short-term trades, we want a more quantitative approach, that’s simple, decisive and won’t wait for an technical level to form …
It’s common sense that, if we want our trade to win, we shouldn’t wait for it to make an extraordinary move before taking profits.
By their nature, extraordinary moves just don’t happen very often.
The problem we have is that the lure of big profits can be overwhelming, and traders over expect too much from their trades.
Unless you have a clear idea of how long you expect to be in the market, and how far you expect the price to move in that timeframe – you shouldn’t be in the market at all.
Before entering ANY trade, you should have an idea of the historical volatility of that market – does it move 100 points a day? Or 20 points a day?
And an easy way to get a picture of this volatility is with the Average True Range indicator. This takes the average candlestick size over a set number of periods and plots this as a moving average.
So, if you’re looking at a daily chart, with an ATR indicator set at 14, it might look something like this …
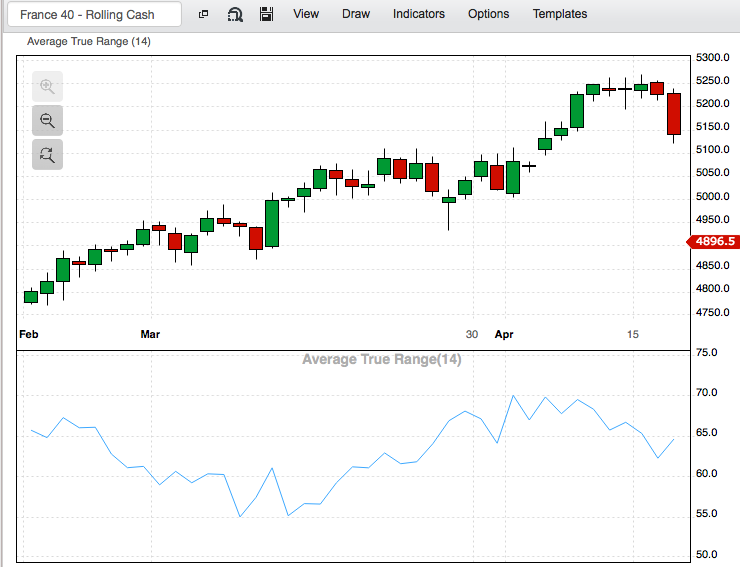
In the chart above, we can see that the average daily range of the CAC index at that time was between 55 and 70 points.
Using the ATR to set your trade exits means having a clear picture of the timeframe you expect your trade to complete in. Do you expect to be closed within the day? Within a few days? Within a few weeks?
When you know that, you can gauge how far the price can reasonably be expected to move.
So, you might set your stop limit at 1.5 x ATR from your entry level (i.e. one-and-a-half times the distance that you expect the price to move). That way, your stop is unlikely to be hit.
And you can use the ATR to judge how much profit you can expect – if you’re expecting the market to move it’s entire ATR during the cause of your day trade, you’re likely to be disappointed.
Look left
So, here we have 3 sensible but simple ways to set stop losses and profit targets for your trades. None of them involve plucking a figure out of the air that you’d ‘like to make’ or ‘are willing to risk’. Instead, they look at what the price is doing, and make an informed decision based on that.
Because we know that market prices never fit with what we ‘want’ them to do – they invariably have minds of their own!
And my final piece of advice in setting stops and targets is … look to the left.
The best clues for future price action are on the left-hand side of chart – what prices did before. Be aware of long-term trends that are underway, and of any key areas or support or resistance that could affect your open trades.
And, as ever, if you’ve any exit tricks that work well for you, please share them below …
To enjoy more content and get it faster Follow @TradersBulletin

JOIN US ...
Get full access to members-only resources, plus my weekly email updates ...
I will NEVER share your details for marketing purposes. Privacy policy
Strategies I'm Using
 It has taken 2 years to persuade this market…
- These videos show how to make 24% gains in…
 As you can see from all the data I've…
 Get the low down on the Heikin Ashi Mountain…





4 comments
Brian Mercer
I tend to use a 2.5x daily ATR as my exit point when trading. Once the trade is in profit by 1.5x daily ATR at the close, I move my stop to day high – 2.5ATR which minimises potential losses. This simple rule is followed as new day highs are reached until either target achieved or trade stopped out. Using ‘double it and add a bit’ as stop guide allows the trade to breathe and only sharp falls take you out. The rule is the same in reverse for shorts
Mark Rose
Thanks for the feedback. To be honest, I haven’t used the PSAR on shorter timeframes – I think that it could be too choppy to use for triggering a trade, but might work as a stop level. Unless you can automate the process with MT4, it would be quite time-consuming moving your stop with every new candlestick.
Geoff
Interesting concept, PSAR. Does it work in shorter, intraday timeframes?
David Mitcher
Very interesting article Mark as I do trade the diff market with core spreads