February 12, 2016by Mark Rose- 5 comments
How to exit a trend
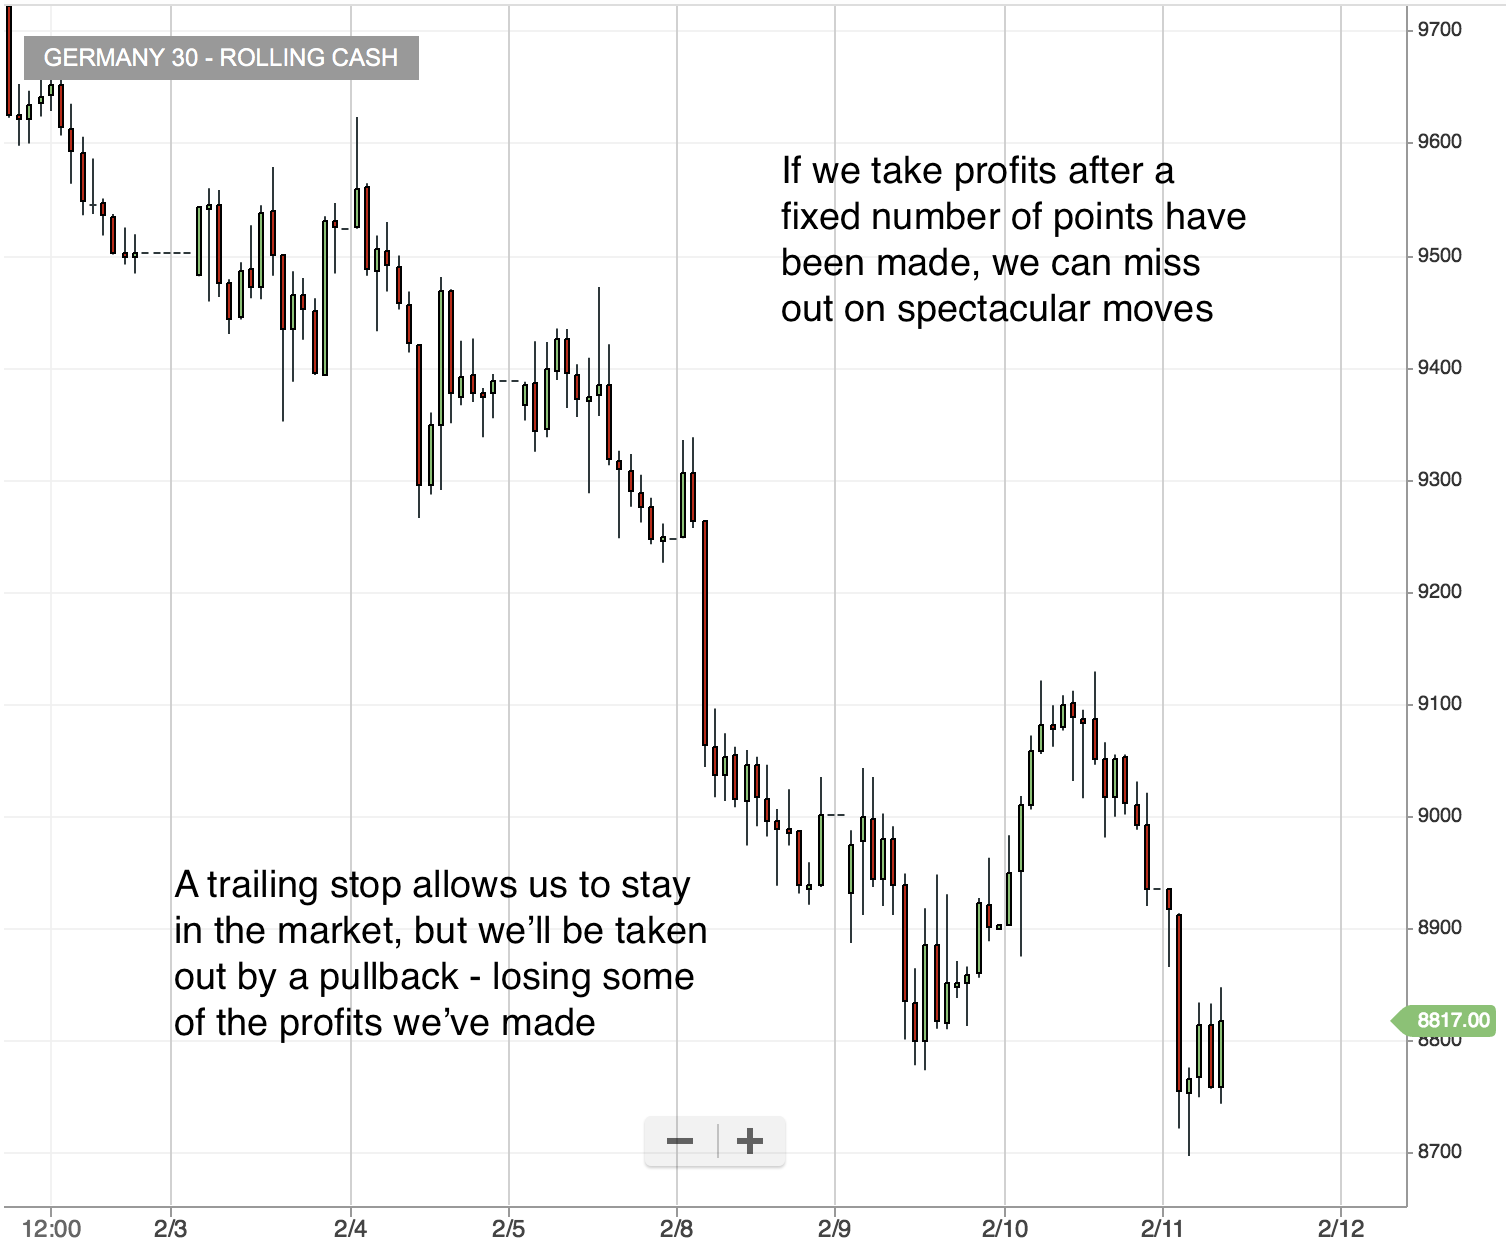
When profits are coming in, it’s easy to get complacent. Especially when we’re riding a nice strong trend. It’s exactly these times we need to be careful – to hold onto those profits, and ensure we don’t end up giving them back to the markets.
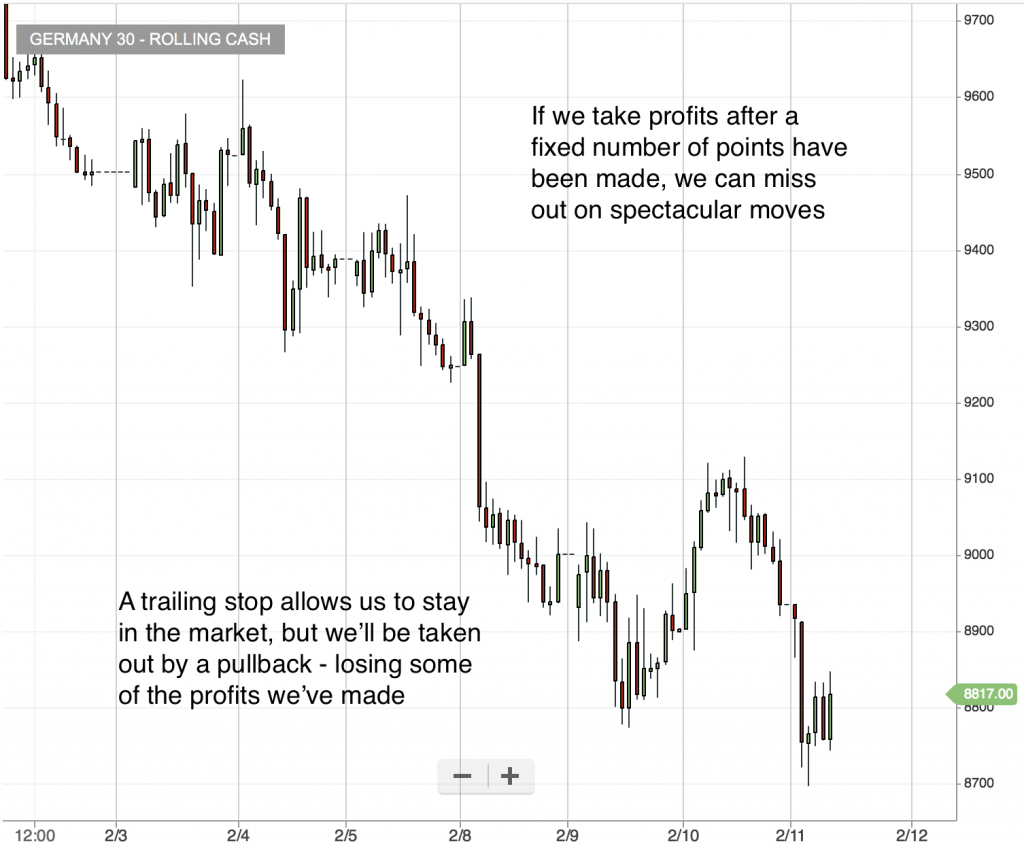
When markets fall, they tend to fall pretty quickly, and everyone wants a piece of those fast profits that are available. That’s where the luckier traders are right now – sitting on profits of short trades, wondering just how much further the market will fall – how much more money can we make, or should we take our profits and run?
By taking profits quickly, we’re not being too greedy … we’re not risking our money in the market … but we’re also not maximizing our up-side …
If we let the profits run, perhaps using a trailing stop … we will inevitably have to give back a proportion of those profits when the market turns and closes us out.
Which is best?
Letting the tail wag the dog
Here’ an example of a trade I had on EURUSD this week …
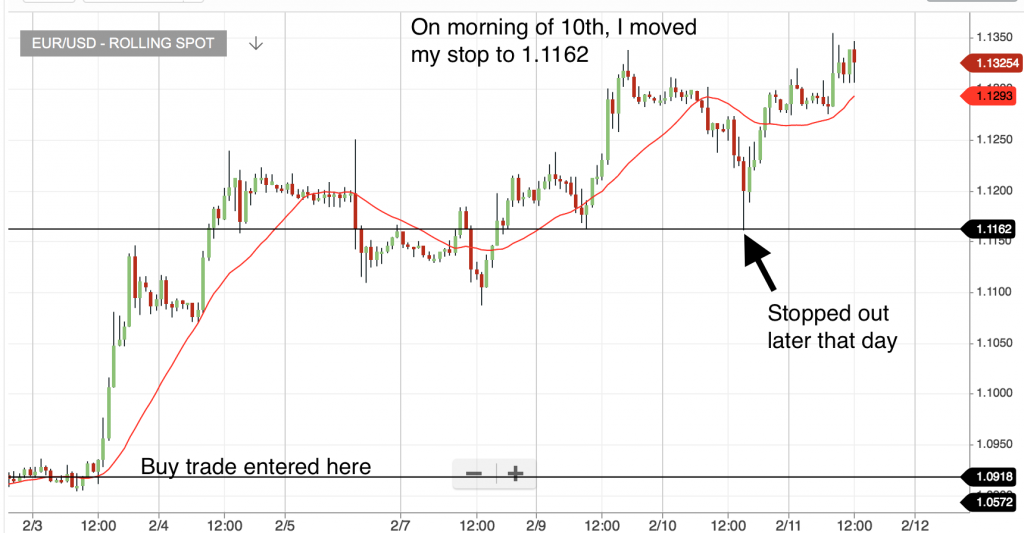
Yes, this trade made 244 pips, but if I’d been able to get out at the top, I could have made another 150 pips or more.
Should I be happy with my 244 profit … or beating myself up about the lost 150 pips?
It’s easy to look at current market conditions, and opt for trailing stops that’ll allow us to catch these big moves, with hundreds of pips profit, but it’s important to remember that not all markets are this volatile, or have such strong trends.
A text-book perfect use of a trailing stop while the market drops sharply, can quickly eat into your profits when markets are range-bound and twitchy.
We need a smarter way to get out of our trend-following trades …
Don’t forget …
The first thing to remember (which is surprisingly easy to forget when you’re in the happy moment of riding a trend) – markets don’t move in straight lines. There will be pull backs – the beginning of a pullback could be a signal for you to take profits. It can also be a signal for you to think about getting back into a trend as it resumes.
The more you focus on getting into a trend on the pullback, the less you’ll stress about getting a maximum profit on the exit. If you get out of the market with some profits under your belt, you’ll be ready to hop back in for some more profits on the next pullback.
Exit technique 1: Fibonacci extensions
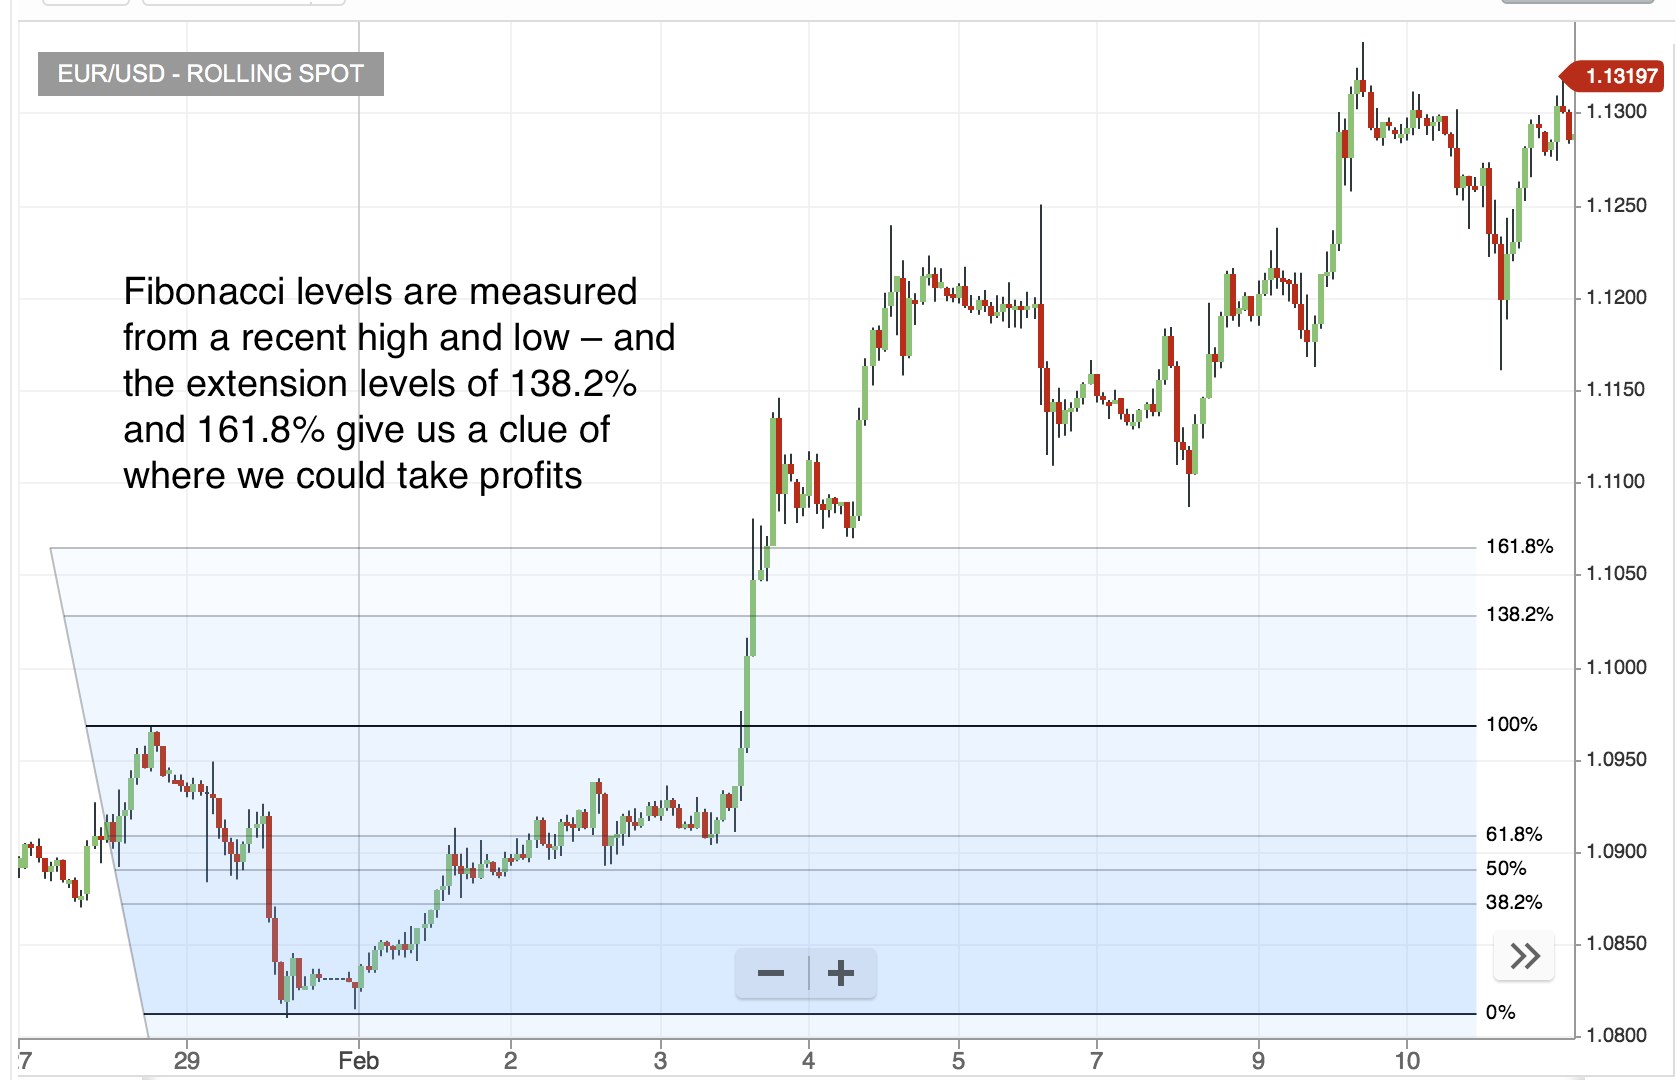
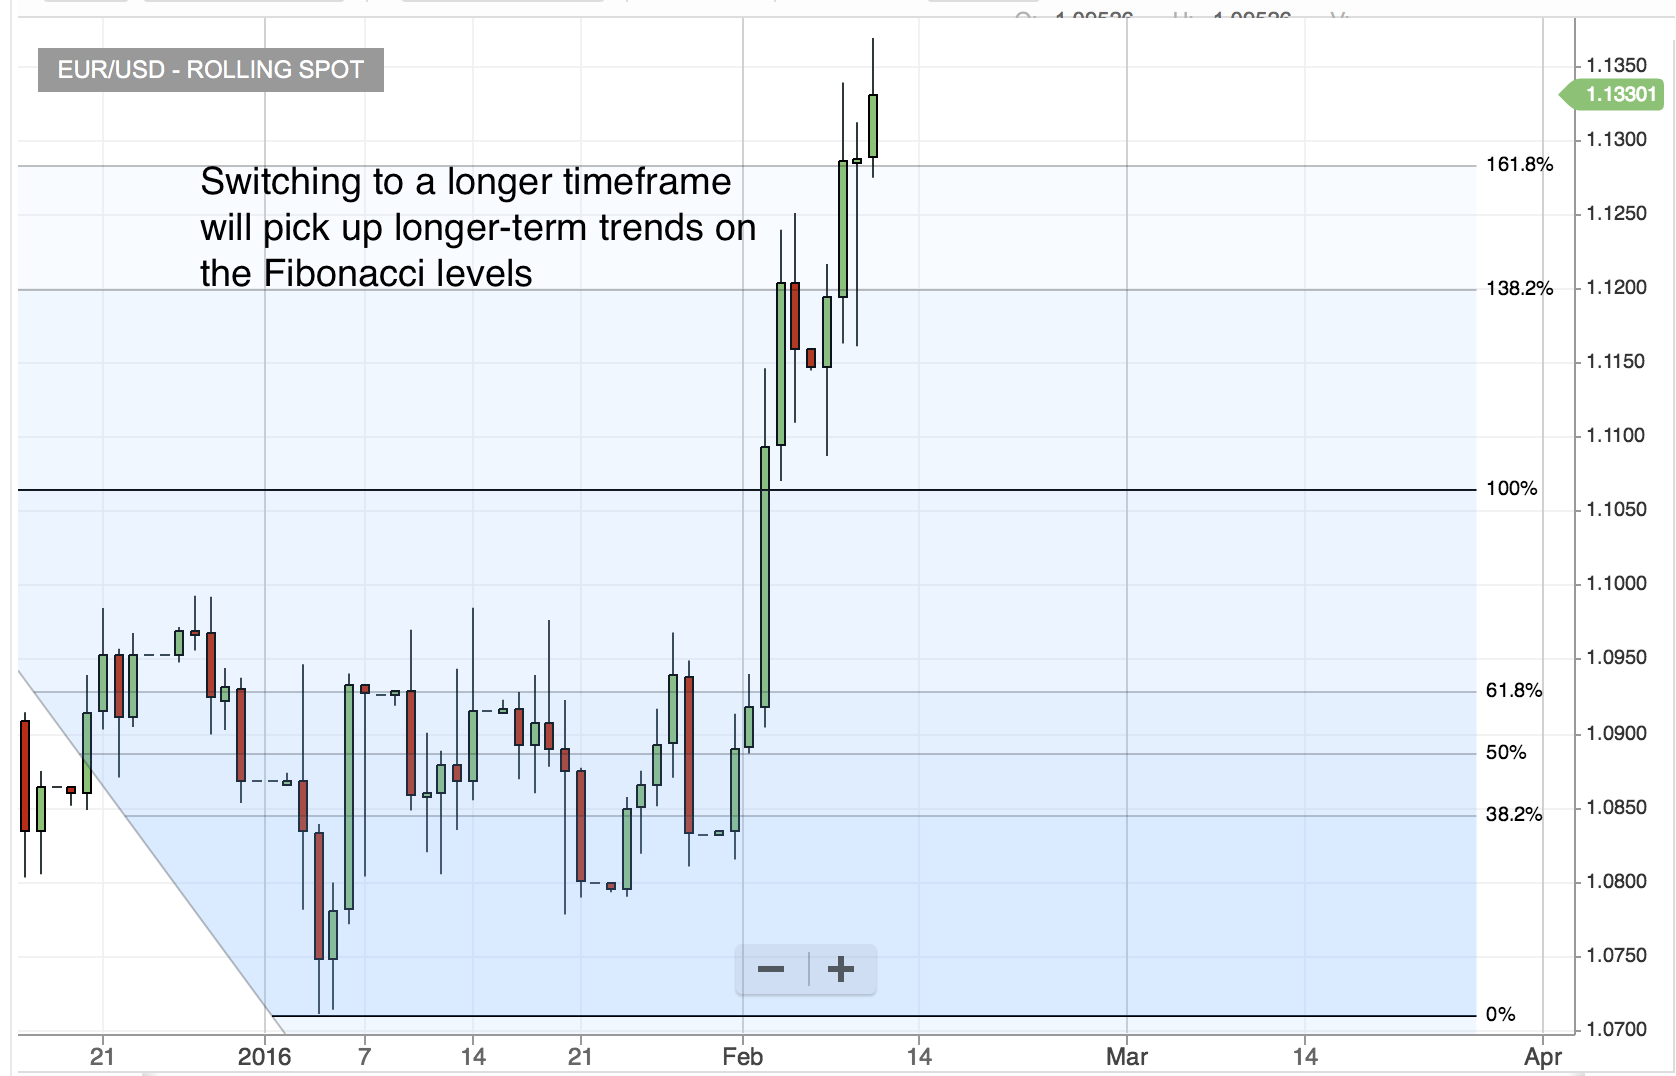
Fibonacci levels are often thought of in terms of retracements, but they can work just as well for extensions.
They are now so easy to add to your chart – you can just select them in the Tools menu. Choose the recent high–low swing that you’re working off (this is where the discretion comes in), and the levels will pop up for you.
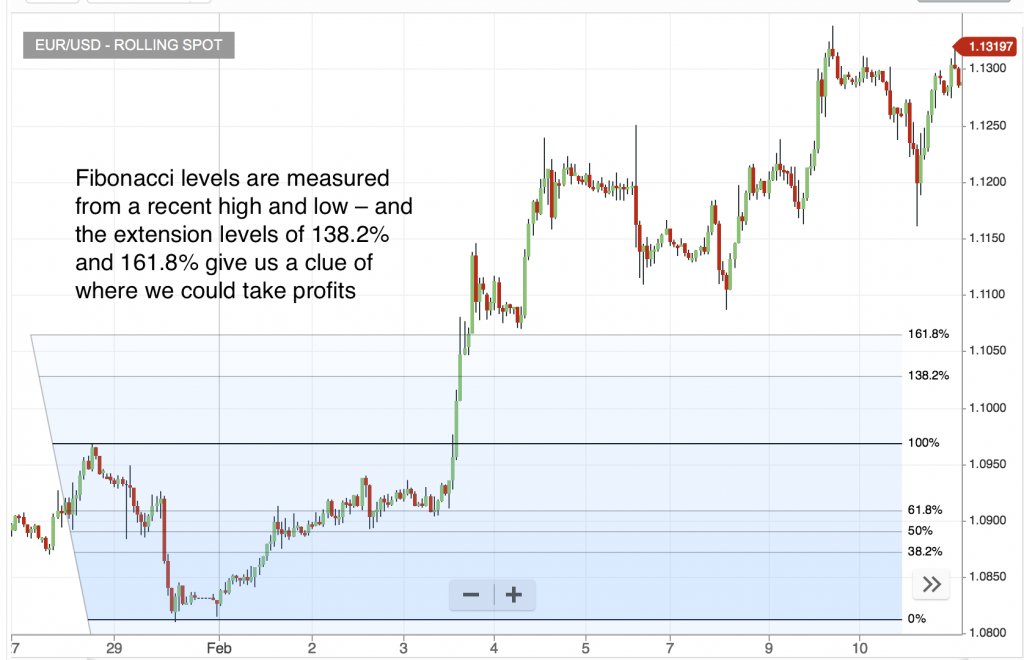
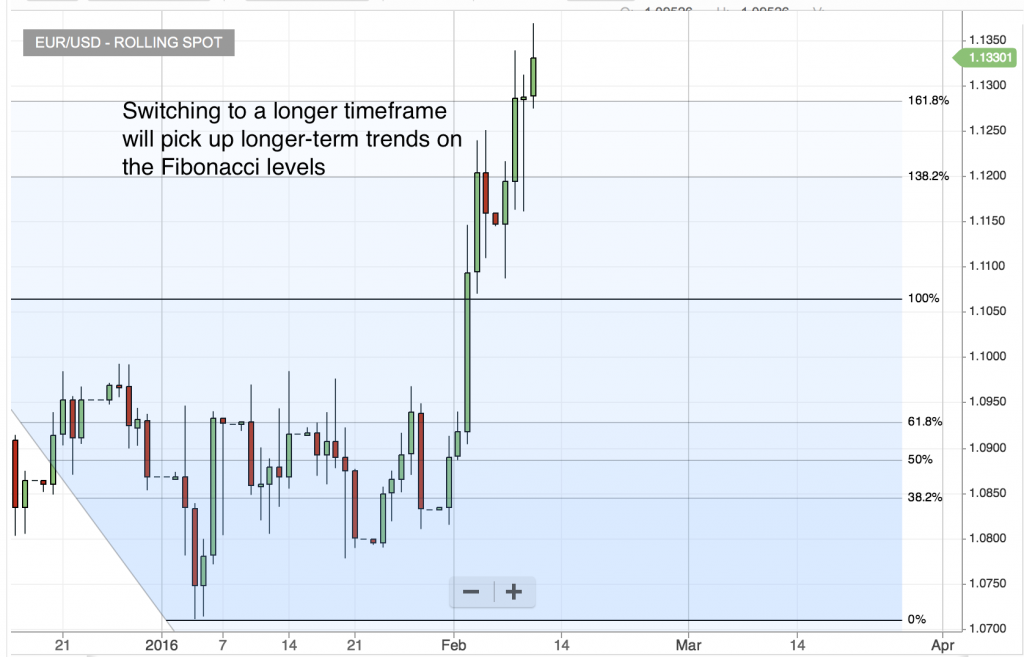
These Fib extensions can make really sensible levels at which to take your profits. The chart above is an hourly one, but looking at a daily chart may highlight a longer-term high–low, if you’re looking to ride a trend over the longer term. …
Exit technique 2: pick a sensible range
While sometimes markets will shoot off rapidly in a trend, for most of the time prices move roughly the same number of pips in a day. There will be volatile periods, when prices move more … and quiet periods, when they move less.
Looking at an indicator like the ATR (average true range), will give us an average number of pips the price moves over the past (normally 14) periods.
Knowing what the ATR is for the daily chart of the instrument you’re trading is a very valuable little gem of information!
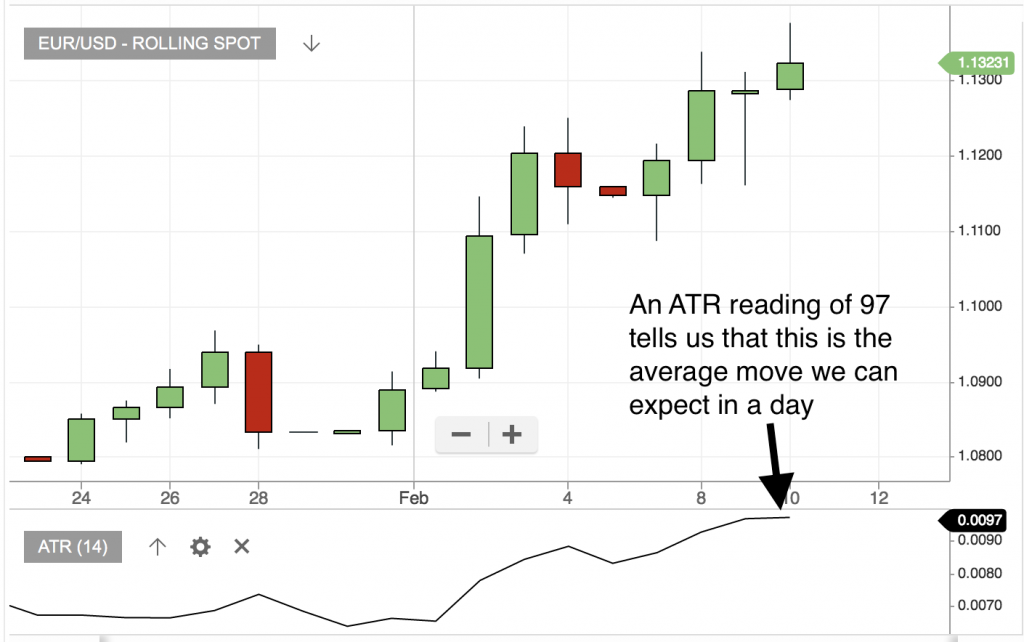
Add to this information the amount of time you expect your trade to be open for – are you looking at several weeks … several hours … or somewhere in between?
Now you can use this knowledge to position both a profit target and a stop level.
Exit technique 3: momentum dropping
Here’s a technical trick to getting out of a trend as momentum fades. In this way, you can hope to be in the trend for the accelerated moments, and out for the pullbacks and the ‘drifting sideways’ periods.
There are a number of ways to measure momentum on your trend … the most obvious being the momentum indicator …
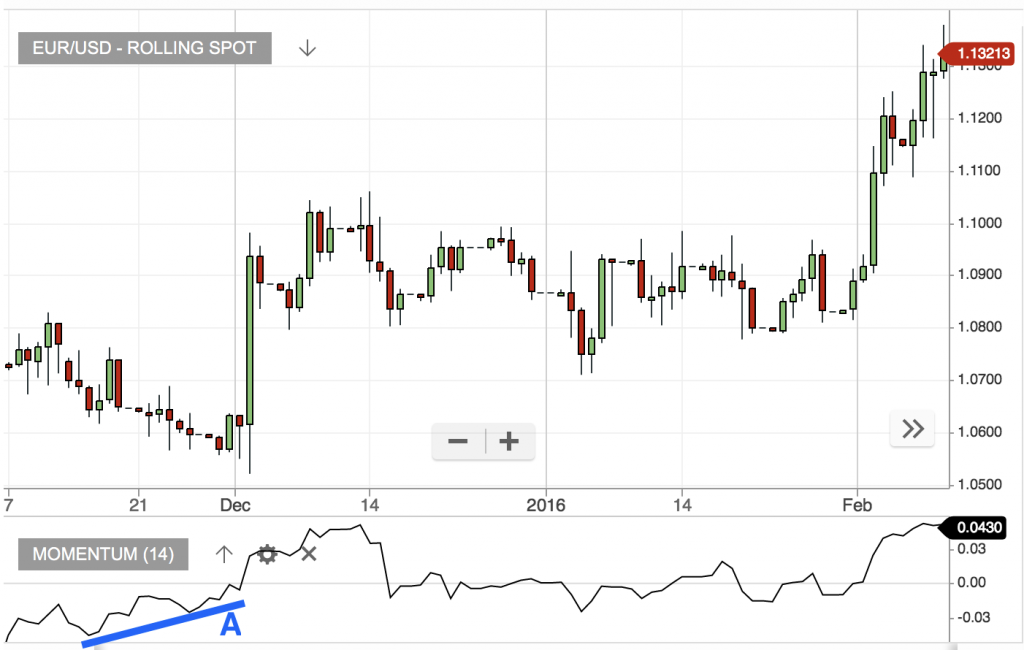
Where the momentum indicator is above 0, it indicates momentum in an upward direction; where it’s below 0, we have downward momentum. However, more interesting to the trend trader is the angle of the momentum line – whether that momentum is rising or falling …
The trend trader will be looking for a drop-off in momentum during a rising trend – this signals that the trend is running out of power.
Likewise, a higher low on the momentum indicator, while prices are falling tells us that the downtrend has run out of steam (as you can see at ‘A’ in the image above).
Other oscillators can be used in much the same way to measure momentum (or lack of it), but those traders already using the Elder Impulse system, will know that the system has a built-in measure of momentum (in this case read from the MACD histogram size). This changes the colour of the price bar, and is specifically designed to warn you when your trend is running low on gas – the perfect moment to take profits, and wait for the right time to get back in just as it’s accelerating out of a pull back.
Of course, remember that no indicator is infallible, and any trend following signal will suffer in sideways markets, which is why a good momentum filter can help keep us out of these trades, or – at worst – get us out fast before we take a nasty loss.
Which exit strategy is the best one for getting out of a trend? My advice is to consider a combined approach – we’ll often use two or three tools to get us into a trade, so why don’t we use a more belt-and-braces approach to getting out of a trade? Fixed exit points based on ATR or Fibonacci levels can be combined with a technical exit that will get you out sooner if the momentum drops off.
Making your exits more technical is a great way to reduce overall risk on your trades and to lock in profits – a win-win!
Here’s that link again to the Elder Impulse strategy
To enjoy more content and get it faster
Save












5 comments
Jason
Mark, in your example of Fib Extensions you have used/interpreted the extension tool incorrectly! You have used the tool to measure an extension of a previous pullback, whereas Fib Extensions (1x, 1.618x, 2.0x, 2.618x) should be said multiples of the prior advance and applied at the extreme of the pullback that followed that motive advance.
Therefore you first need to measure the prior advance, then place the Fib tool at the extreme of the following pullback and pull it out until the 100% line is equal (thereabouts) to what you have just measured for the prior advance. You should then find that the said Fib Extensions will coincide more often than not with subsequent extremes of price.
Phil
Some of the charts are missing please send again with all charts
Mark Rose
Hi Phil, I’m not clear on what’s missing – could you drop me an email showing me what you’re seeing. Is it a problem with my email to you, or with the web page?
Mike
Thanks for this Mark. Where would you recommend putting a stop and target based on ATR? If you’re trading hourly charts?
Mark Rose
Hi Mike, There are a few things this would depend on, like your attitude to risk … your risk-reward profile, etc. But there are some principles you can work off. I’ll go into these in more detail next week, so please watch for my next update.