Technical indicators can be confusing … are you reading them right? Is that really going up/down? Are the candlesticks really making a pattern?
But a crossover is hard to argue with. And that’s what makes them such nice simple entry tools.
Here are my top 3 crossover signals …
Moving average crossover signals
Sometimes the oldies are the best. The moving-average crossover is kindergarten-level trading signals, but it’s one of the first we learn for good reason – it’s a solid, reliable signal.
Of course, there’s a lot of variation available in a moving average cross – which number of candlesticks our MAs are looking back over, and whether we’re using EMAs, SMAs, WMAs …
But let’s start with the classic: simple moving average. And we’ll consider the most important ones of these …
If you’re trading longer term, it’ll be 100, 200 or 500 periods
If you’re trading shorter term, it’ll be 5, 10, 20 or 50
Let’s look at the middle of that range. Here’s a 4-hourly chart on GBPUSD with 20- and 50-period simple moving averages …
When the faster moving average (the 20SMA) crosses below the slower one (the 50SMA), the signal is that the market is in a downtrend. When the 20SMA crosses above the 50SMA, the signal is that it’s an uptrend.
Moving averages aren’t doing anything cleverer than giving us a smoothed-out picture of which direction markets are moving in. But that doesn’t mean there aren’t clever ways to apply this information.
It can be incredibly difficult to ascertain market direction when we’re just watching candlesticks fly at us from the right of our screen. Moving average crossovers can make sense of that.
But … you’ll see on the image above that the cross comes some time AFTER the move has kicked in. The moving average, by its nature, is a lagging indicator. These crossovers aren’t giving us finely tuned entries into the market.
If you want something more laser-focused, the next crossover might be for you …
Stochastics crossover signals
Pop a Stochastic indicator onto your chart, and you’ll see that it’s littered with crossovers …
It might be hard to see how useful a crossover is when they happen this often, but a Stochastic crossover is a fantastic trigger trade.
Here’s an example of how it works …
On the chart below, I’m looking to enter this downtrend as the price bumps up against the moving average. But when is the right moment to actually hit that sell button?
The Stochastic crossover alerts us that conditions are right for the price to accelerate away in a downward direction – this is our entry trigger.
Like the moving average crossover, the Stochastic crossover doesn’t work in isolation – it’s part of a trade entry. If you’re looking for a crossover that covers all the jobs, then the next one might suit you …
Ichimoku crossover signals
The Ichimoku indicator might look like ‘a lot’, but here we have trend, momentum, support and resistance all in one (slightly untidy) package.
Like I said, it’s a lot.
But, if you break it down, we’re kind of looking at two pairs of moving averages, plus that lagging Chikou Span line.
Our first pair of lines make up the cloud. This is a nice visual tool. If the price is above a green cloud, we’re looking for buy signals, if the price is below a red cloud, we’re looking for sell signals.
The next two lines are called Kijun-sen and Tenkan-sen, or the Base and Conversion lines. These work just like our moving average crossovers, although the maths behind them is slightly different.
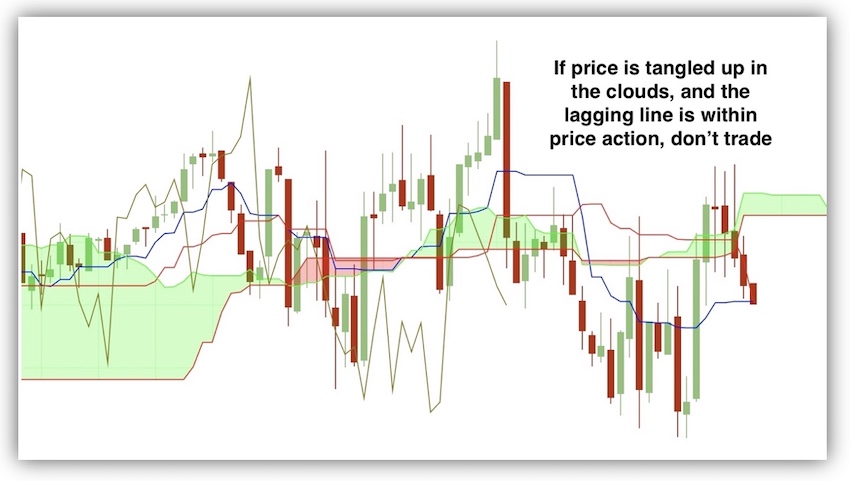
The final line – Chikou Span – is simply the current price but plotted 26 candles back. If this is embroiled in price action, it’s a warning that we’re snarled up in a consolidation or sideways action. If it’s in clear air – that tells us that we’re in a breakout or a trend.
Here it is in action …
A lot of traders are put off Ichimoku because it looks cluttered and difficult to read, but I’d stress that this is designed to be an at-a-glance indicator. If it looks horrible and messy, then it probably isn’t a signal. If it looks nice and clear, then probably you should be watching it.
If your chart looks ugly, steer clearIchimoku signals are designed to jump out at you
Putting it together
So, that’s my top-three crossovers. Let me know what you think, how you use them, and which crossover signals you prefer.
And if you want more crossover strategies, check out my Double MACD method here.













2 comments
Bill Morrow
Hi I like what I see and want to learn more so I can trade and make an income
Mark Rose
Delighted to have you onboard Bill!