Adding a filter to your trades means you take fewer
trades in total, but your success rate should be higher.
I’m always loath to take the route of ‘just stick
another indicator on’ style of trading – it can lead to confusion, doubling up
of signals and unnecessary complication. But some indicators are worth adding.
Here are my top 4 extra filters …
1) R-Squared
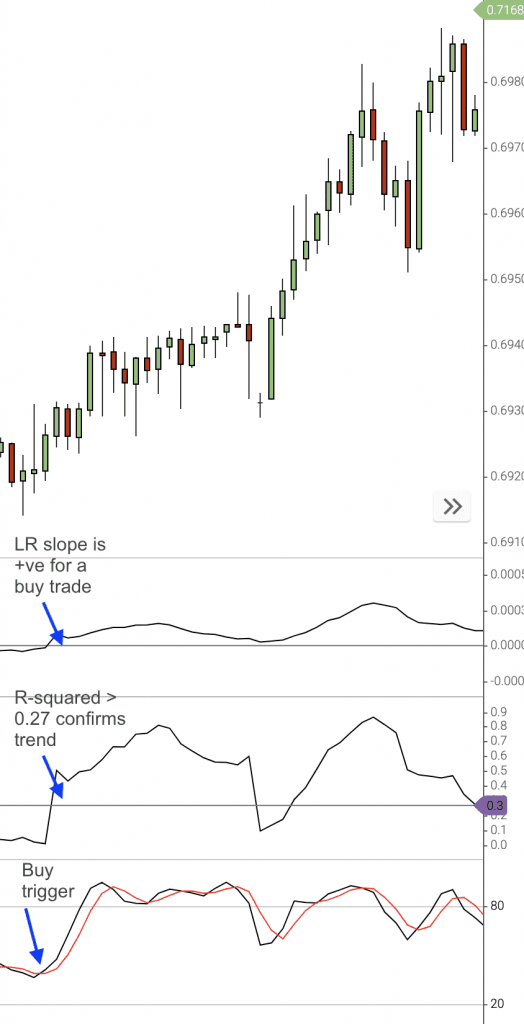
As we’ve seen, the R-Square filter is a simple
two-step process …
1. The LR slope should be above zero for a buy trade.
The LR slope should be below zero for a sell trade.
AND
2. With the R-squared indicator at its default setting (of 14), this level should to be above 0.27 to confirm the strength of the trend.
2) ADX
The Average Directional Index (ADX) is an indicator
wrapped up with the Directional Movement Index, and is often shown as three
lines on a chart: +DI, -DI and ADX.
The +DI is a measure of the up trend; the -DI is a
measure of the downtrend; and the ADX is a strength indicator.
To use this as a filter, you might add these criteria
to your trades …
We’ll only take a BUY trade if:
• +DI >= 25
And
• ADX >= 20
We’ll only take a SELL trade if:
• -DI>= 25
And
• ADX >= 20
What this aims to do is to keep us out of trends when the market direction isn’t clear or strong enough.
3) Stochastic direction
The Stochastic oscillator is a a very sensitive trading tool. As a leading indicator, it can often tell us about market moves before other indicators have woken up. On the downside, this means it can give us lots of false signals.
A way to use this to our advantage is to wait for our
signal, but look back to confirm that the Stochastic also saw this move (often
a couple of candles earlier). If the Stochastic didn’t notice it – maybe this
setup isn’t worth taking.
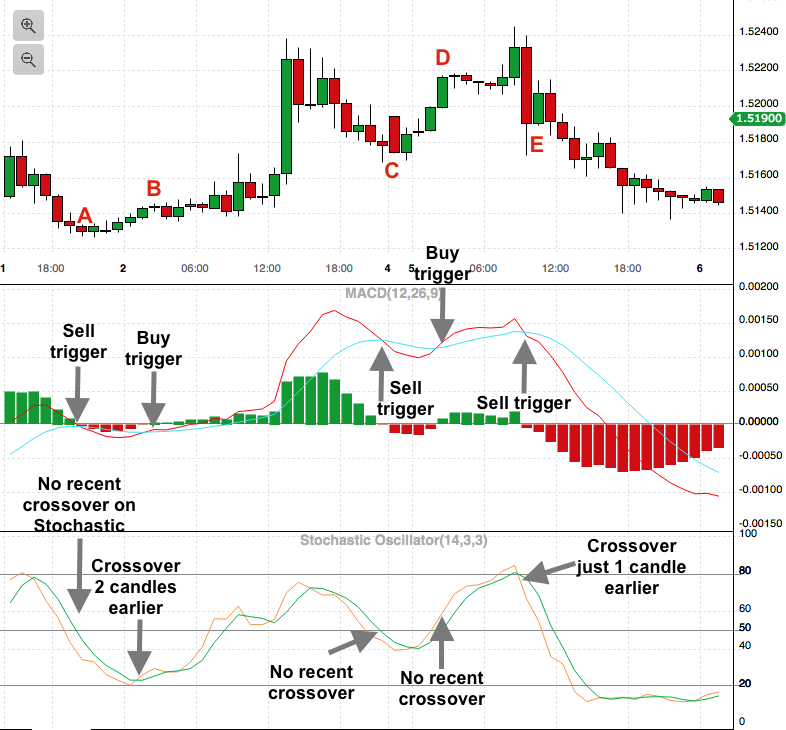
Here’s an example in which we’re look at MACD crossovers to enter a trade, but we’ll only take a MACD signal if the Stochastic also crossed over within the previous two candles …
At A, we have a sell trigger on the MACD, however the crossover
on the Stochastic was much earlier, which tells us that this signal isn’t worth
risking our money on.
At B, we have a buy trigger on the MACD, and the Stochastic
trigger was just two candlesticks earlier, which confirms this as a buy.
At C, we have a sell trigger on the MACD, but there’s no recent
trigger on the Stochastic, so this isn’t a trade.
At D, again the MACD trigger isn’t backed up by the Stochastic
(the Stochastic crossover was three candles earlier, so this doesn’t count as a
trade).
And at E, we get the MACD and Stochastic crossovers almost
simultaneously – signaling a sell trade.
So, we get a Buy at B, and a Sell at E, which both look like
good places to be getting into a trade.
4) MacD direction and size
The MACD is a neat indicator which using
moving-average trend indicators to build a measure of momentum.
It’s made up of two lines (a slow and fast line) and –
the bit I’m particularly keen on – the histogram, which measures how those two
lines are moving against each other.
The histogram will be +ve in an up trend, and -ve in a
downtrend, but when the size of the histogram is increasing, it suggests that
the trend is gaining strength.
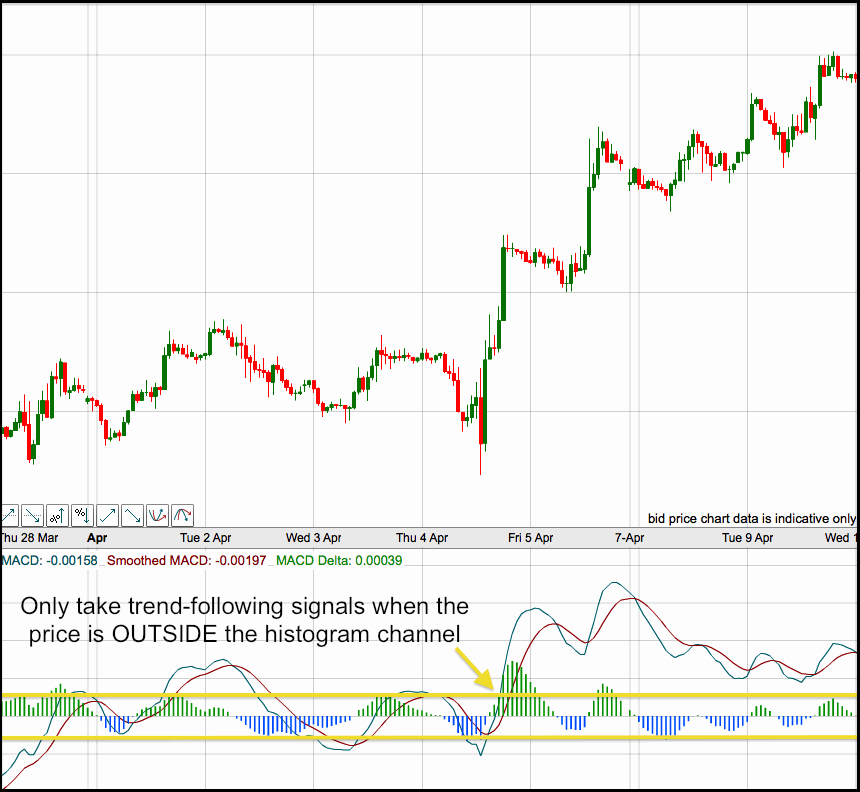
There are a number of ways you can use this to filter out trades, but one way is to set a minimum size the histogram needs to be to accept a trade. Getting the right figure on this can be tricky – it’ll really depend on your instrument – but it’s worth trying it for size …
In the image above, I’ve drawn in a channel around the
histogram, and will only take by or sell trades if the histogram is outside
this range.
Picking the right filter for your strategy
The main error traders make when combining signals is doubling
up.
If you’re using moving average to find your entry,
don’t double on with the R-squared for your filter.
The chart below shows different indicators classified by trend, volume, momentum, etc – try to have indicators from at least two of these groups and watch the signals you’re getting. Bear in mind that something like the MACD may be a measure of momentum, but it’s built on moving averages, which is why I’ve spanned it across both these categories.
If you’re using two indicators which ALWAYS agree – it might feel nice to get that confirmation, but it’s unlikely to be adding any benefits to your trading!