August 5, 2011by Mark Rose- 3 comments
How to get advance warning of price behaviour
There’s a mood of change in the air.
A lot of people are talking about it.
Is the bull run finally over? Are we about to enter a bear market?
I don’t know the answer to that question, I’m afraid.
But I do know that there are head-and-shoulders and double-top patterns forming all over the place on indices.
I also know that it’s been a while since I’ve been able to draw a really useful long-term trend line on a good number of charts.
If a new trend is forming, and our old trend lines are being thrown out – where do we look to for guidance on future price behaviour?
Over the coming weeks, I want to look at ways in which we can predict where prices will rebound … where they will stall … and where they will accelerate … without relying on a technical indicator …
How prices can have long memories
A few times each year, the Rose family pile into the car and head north on the 5-hour drive to visit my in-laws.
And I’m always amazed how, on that long journey, again and again, our stomachs rumble or someone needs a “comfort break” at exactly the same places. There are a handful of lay-bys and service stations that we are far too familiar with!
It’s as if our bodies have a built-in memory of the journey.
And I see something very similar with price action – a kind of “memory” of where it has stopped before.
These price “lay-bys” are called support and resistance levels – and you may be surprised by just how long these memories can last…
Support and Resistance levels
Resistance is an area where price was rejected and then fell back or consolidated. Support is an area from which price rebounded or consolidated. Prices tend to cluster around these prior support and resistance levels.
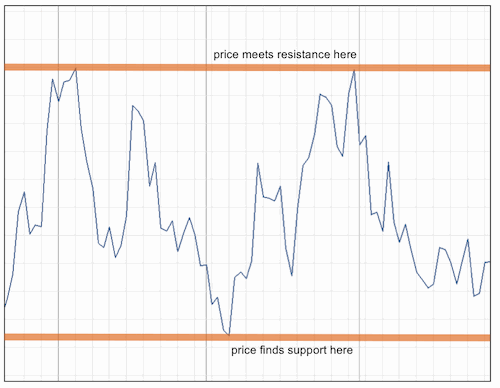
Of course, prices don’t conveniently bounce around between two fixed lines of support and resistance. As you can see in the chart above, the price often fails to meet prior resistance, or rebounds before it hits support levels.
And, of course, sometimes it moves straight on through these lines.
However, by better understanding these levels, you can know in advance where price might hit resistance or find support.
Make a note of these levels – you might be needing them later
As I write this email (on Thursday lunchtime), the FTSE has just broken below a serious level of support at around 5500.
So, the first thing I want to know is – where will it go next??
Here’s a daily FTSE chart on which I have support and resistance levels marked going back to May last year …
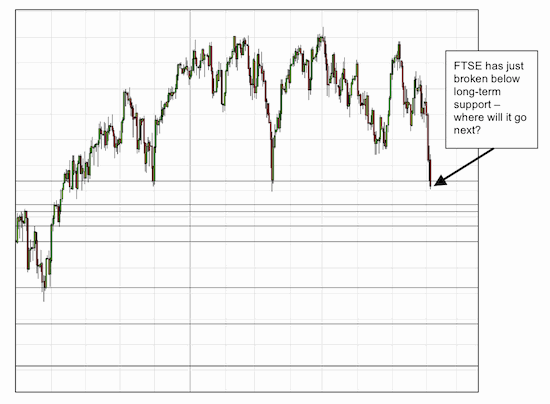
All those lovely back horizontal lines on my chart are telling me exactly the key levels that I need to watch out for.
These were the support and resistance levels that the FTSE met on its way up, and – provided it’s price memory is still working – these are the same areas we should be looking at on the way down.
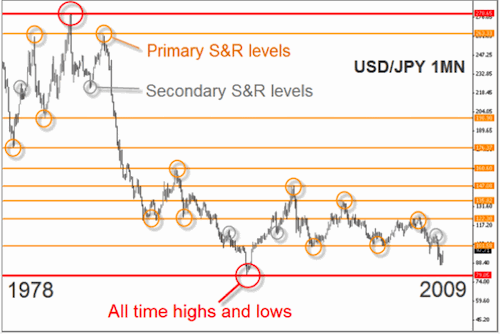
If you’re in any doubt about the validity of long-term memory in the markets, take a look at this forex chart I came across on FXStreet dating from 1978 to 2009:
So, how do we locate these levels …?
Drawing lines of support and resistance levels
The general purpose of a support or resistance line is that the price has hit this level, and then reversed or consolidated at it. This means that a level might be a “one-touch” market top or bottom. Or it might be a level that the price repeatedly pushes against, with many, many touches.
Ideally, we’d have at least two contact points where the price has bounced. The more contact points you have, the more relevant that level becomes.
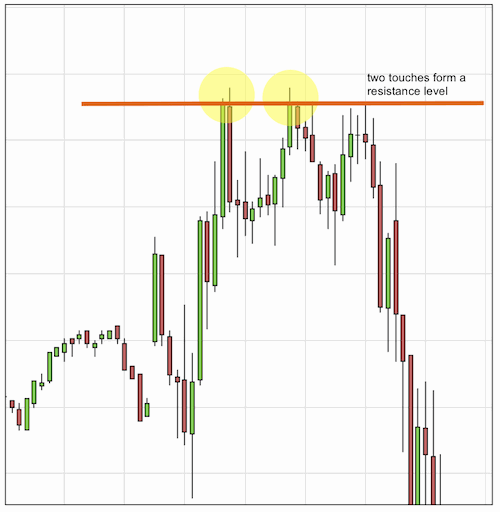
However, it’s tricky to make hard and fast rules for how to draw these lines – there is a degree of discretion demanded by them.
For example, you don’t want to end up with a cluster of lines so close together than they no longer serve any purpose – you’ll need to decide which are the most important levels, and dismiss the others.
Likewise, you may find that over the long term, these lines need to be moved slightly – a few points up or down – as they will naturally migrate a little over time. (The more recent a support or resistance level has formed, the more valid it is.)
Take a look at a daily chart and start drawing in some lines going back over the past year or two – it’ll take a bit of practice, and you shouldn’t be afraid to move them about or adjust them.
(Make sure that your charting package allows the lines to continue into the future.)
Then, scale down to a shorter-term chart and start using these lines in your trading. Even if they aren’t directly related to your trading strategy – knowing where they are is a good psychological reminder for you of where prices have stopped in the past, plus, it can help you avoid putting your targets and stops in the wrong place.
And anything that gives us that kind of heads-up, is going to help our trading.










3 comments
Mark Rose
Hi Paul, I’d start off with picking support and resistance from daily charts and see how you get on – you don’t want to overload your charts. I’ve got lots more info coming up on support and resistance levels in the next few weeks. Plus, there’s a really interesting strategy I’ve been applying using Fib levels – if it lives up to its promises, I’ll be passing on all the details soon.
David Haines
How nice it is to receive e mails that are genuinely useful as opposed to those constantly attempting to ‘flog’ another new product. So thank you Mark for that. Recently I received the following e book link from Rita Lasker who said it was OK for me to forward it on to a number of people. Very interesting reading and very useful for someoe like me who ias agreat procratinator. I think the most difficult thing is to actually begin trading with real money although I do believe that a learning process is essential if you are to have any chance of success trading manually. So here is the link.
http://www.ritalasker.com/secret1.htm
Regards: David.
paul wetherill
thanks for the article on support and resistance, i am uncertain as to how many time frames up i should draw the lines to trade the lower time frames, usually the 5 min. i will try this out in addition to fib levels
regards paul