March 30, 2012by Mark Rose- 0 comments
Do Fibonacci retracements work?
There’s a subject that many Bulletin readers have asked me to cover over recent months (even years).
And, I’ll be honest with you, it’s an area that I’ve been avoiding.
It’s one of my least favorite pieces of technical analysis.
To me it seems a bit off the wall … I can’t see the logic of why prices should behave this way.
But there’s a glaring fact that I can’t ignore: if enough people believe in a technical signal, it will become self-fulfilling.
Which is why, much as it niggles me, I’m wrong to ignore this.
So … here goes …
Rabbits … honey bees … sea shells … and pinecones
The number I’m talking about is 1.618
It’s the magic number that’s at the heart of the Fibonacci series, and forms the backbone of a very widely used area of technical trading.
Leonardo Fibonacci was a 13th century mathematician who, among other achievements, brought the numbers 0–9 to Europe, long before Big Bird off Sesame Street got the idea. And very useful they’ve turned out to be.
What he’s most famous for, however, is his ability to count rabbits.
The question that Fibonacci posed was how fast rabbits could breed. Let’s say we’ve got two rabbits. After a time, they produce two new rabbits. Then, after a time, these four rabbits produce four more rabbits, and so on ….
The number of rabbit pairs each month goes something like this: 1, 1, 2, 3, 5, 8, 13, 21, 34, …
Have you spotted the pattern?
Each number is the sum of the previous two numbers.
The number size increases in a spiral pattern, like this …

And it isn’t just rabbits …
Fibonacci sequences can be seen all over the natural world … in the way things grow, be they snail shells, the pattern of the florets in a flower, the bracts of a pinecone, the scales of a pineapple, a single cell or a hive of bees.
Plants and animals don’t know about this sequence – they simply grow in the most efficient ways. Many plants show the Fibonacci numbers in the arrangement of the leaves around the stem. Some pinecones and fir cones also show the numbers, as do daisies and sunflowers. Many other plants, such as succulents, also show the numbers. Some coniferous trees show these numbers in the bumps on their trunks. And palm trees show the numbers in the rings on their trunks.
Why?
Well, spirals are an efficient way for things to grow.
But the Fibonacci proponents don’t stop there.
Applying Fibonacci to economics
These Fibonacci patterns are really neat. And I can understand why people become enthusiastic about them, and want to apply them again and again.
Proponents will tell you that if a pattern recurs again and again, we should listen to it.
But the temptation is to try to make everything fit into these tidy patterns.
These spirals occur in population growth, in cell development, in DNA, in our brains, and, many people believe they can be carried across into the very way we think and in how companies and stock markets grow.
Those on the other side of the argument, will call this sheer number mysticism.
Perhaps if we look on a grand scale of human population growth and economic achievement, we could see patterns. But predicting where the markets will turn on a short-term basis?
I’m cynical.
Personally, I try to keep an open mind about methods of analysis. And I won’t claim to know a lot about the workings of the human brain.
But the one thing that I do know is that a lot of traders use these Fibonacci levels in their trading, so they inevitably become key areas for stop losses and profit targets.
And that’s why, however skeptical I am of the logic behind them, I can’t dismiss them out of hand.
Know your levels
So, if I’m going to give Fibonacci levels the time of day …
I’d better understand how they work.
Here are the key facts.
The ratio between consecutive Fibonacci numbers (i.e. dividing one number by the next) moves towards the magic “golden ratio” number of 1.618 (or its inverse, 0.618).
The magic levels are at:
61.8% (found by dividing one number in the series by the number that follows it)
38.2% (found by dividing one number in the series by the number two places to the right – is it just me, or is this getting more tenuous?)
23.6% (found by dividing one number in the series by the number three places to its right. Still with me?)
So, the purist Fibonacci fan will draw lines on his chart at 23.6%, 38.2%, 50%, 61.8% and 100%, and will expect retracements to fall at these levels.
Hang on – where did that 50% come from?
It’s nothing to do with Fibonacci. The 50% line is actually to do with Gann (another mathematician who liked drawing lines on charts), but seems to have been appropriated by Fibonistas.
So, our most important Fibonacci levels are: 23.6%, 38.2%, 50% and 61.8%.
(There’s also one at 76.4% if you don’t feel you’ve got enough lines on your chart yet.)
Marking up your charts
One of the trickiest things about Fibonacci levels is marking them up on your charts.
It’s not like other technical indicators, where you just click on a box at the side of your screen and they magically appear.
Instead, we have to judge the recent high and low that we want to base our Fibonacci levels on. And recent highs and lows can be subjective, so by the time you’ve added these on, then drawn extra lines in at 23.6% and 38.2%, 50% and 61.8% … there can be quite a disparity between where one traders Fibonacci levels are and those of the next trader.
But this is a rough idea of how it works …
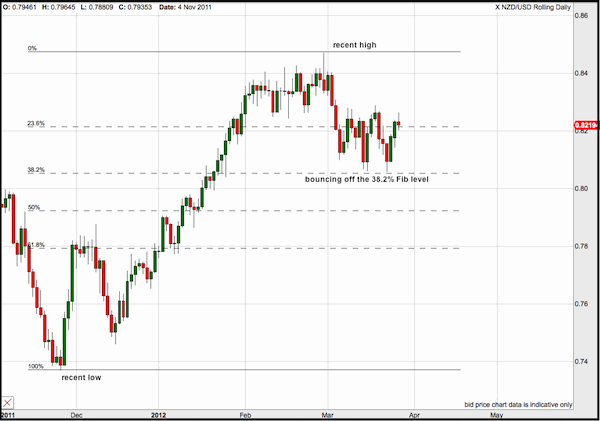
Whether or not you believe that these Fibonacci levels hold a mystical power over currency prices – there’s no doubt that they can be key levels for traders to position stop losses and profit targets, which is why we’ll see behaviour like this, where the price finds support at the Fib level.
Or, like this, where it hits resistance at these key levels …

If I’ve come across a bit scathing about Fibonacci levels, I apologise to any hardcore Fibonistas out there.
As traders, we can’t use every single piece of technical analysis, or we’d be so busy drawing lines that we’d never get a trade on. So, there are areas that we’re naturally drawn to – or not!
But I hope to bring you some practical ways you can use Fibonacci levels over the coming weeks – so there’s plenty more to come.