June 19, 2013by Sophie Rose- 2 comments
Pt1: What are Fibonacci Retracements?
Welcome to my first Trader’s Bulletin Fibonacci tutorial. My name is George, and this week Mark Rose has asked me to take over the reins of Trader’s Bulletin to explain just how powerful Fibonacci levels can be in your trading, and how to unlock their secret patterns to release serious profits into your account.
In trading, success is all about getting an edge over the market – which means having an edge of the majority of traders out there. Over the years, I’ve found several tools that give me a big advantage. This guide introduces you to one of the most important of them: Fibonacci Trading.
I’ll explain more detail in a moment, but first, let me show you why Fibonacci can works.
Where is the market going to?
It’s the question we all want an answer to, and investors use a great number of tools to help them – from technical and fundamental analysis, to following market gurus or just sticking a pin the financial pages!
Many years ago there was that famous book called A Random Walk down Wall Street, which claimed technical analysis was flawed and could not be used to produce successful results.
There were and, I’m sure, still are those who have no time for technical analysis and believe that either:
a) price moves at random and there is no valid way of predicting the future, or
b) market players manipulate price to where they want it to go, or
c) herd behaviour governs the markets.
I’d like to address the question of whether a tool like Fibonacci retracements really can help us to predict where prices will move to.
So, do the three forces listed above really move markets?
(a) The reality of trading is that as there are so many market participants who will have similar aims that patterns will emerge, negating the random walk theory. At any one time, there will a mix of long-term holders and short-term speculators – those who need to sell and need to buy. Once this mix of traders is balanced then the price settles to a range; once it imbalances, then trends develop until the supply–demand balance returns. There’s nothing random about this process!
(b) There is perhaps greater truth in market manipulation. How often have you read a stock upgrade or downgrade only to find price moves in the opposite direction as the main players in the stock sell into buying strength on the upgrade news and the reverse of a downgrade, resulting in an up move once the initial selling subsides. But even this kind of manipulation will follow patterns.
(c) Follow my leader, or doing what the rest of the herd is doing can be seen in moves that shoot off in one direction and then reverse running back again. If you’ve ever seen a herd of cattle spooked by a barking dog, you’ll recognize that the way markets move isn’t so different! And any psychologist will tell you that herd behaviour is much easier to predict that individual behaviour.
So, if there are patterns in market behaviour, then we can rely on technical tools to help us recognize them.
Trends make the money …
In order to make money from the markets – we need them to move. And catching these trends, when prices are travelling from one level to another is the key to trading success.
However, trends rarely move cleanly from one area of price action to the next. A process of backing and filling takes place, caused by profit takers jumping out of the market and by opportunists looking for counter trend rallies or corrections.
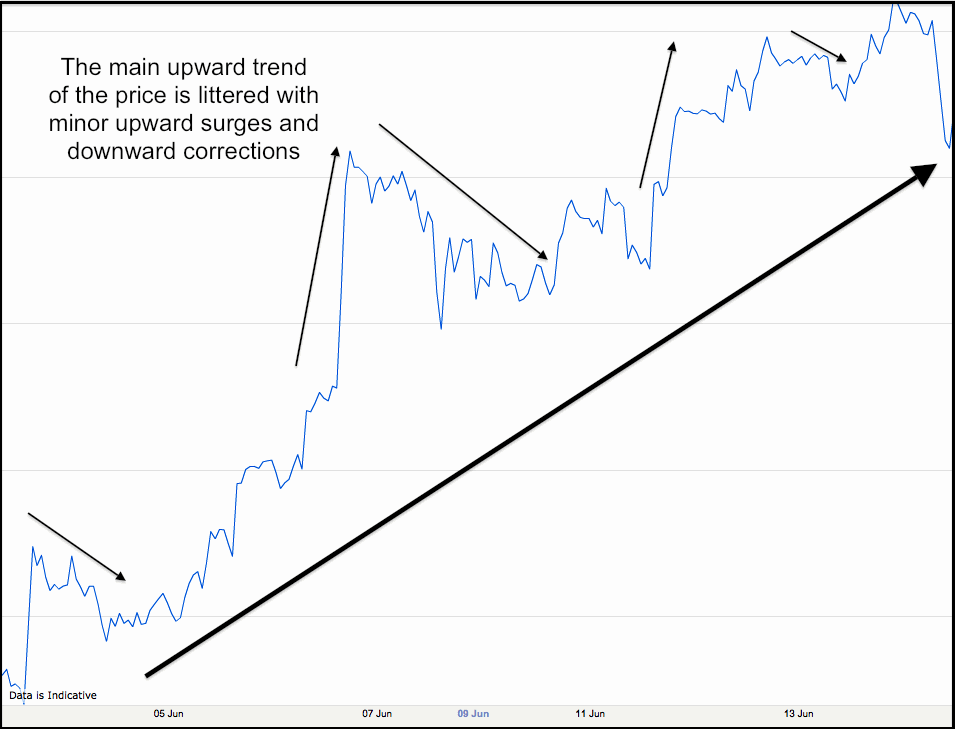 These little ups and downs along the way will often shake out weak traders from the main trend – I’m sure we’ve all experienced this at some point, when you think you’re in a trend, only for the market to pull back and knock you out.
Meanwhile, it’s exactly the same little ups and downs that allow stronger players to add in to positions as the rallies or corrections revert back to the main trend.
And the tools I’m going to give you this week will show you how to use these corrections, ensuring that you’re one of the strong players who’s profiting, instead of one of the weaker ones, who’s getting stopped out.
There are several ways of looking at trends and finding the optimum entry and exit points, but Fibonacci levels provide some of the most powerful clues to where price is now, where it has been and where it might go next.
What is Fibonacci?
Fibonacci is based on the number sequence 1-2-3-5-8-13 and so on to infiniti.
Leonardo Fibonacci discovered this number sequence way back in the twelfth century. He carried out research that linked the sequence to many naturally occurring phenomena.
By dividing one number by the next, the ratios of 0.681 and it’s reciprocal 1.618 are found. Many believe these ratios have mystical significance as they are found in calculations relating to the ancient pyramids and throughout nature, in sea shells, petals, and the relationship between the lengths of bones in the body and so on.
So is 0.618 the answer to the universe and everything within? Or is it just a self-fulfilling prophecy, when applied to the markets?
I subscribe to the latter, as mysticism, astrology and the like don’t sit easily with me.
If there are thousands of traders out there who are following Fibonacci, then I want to know what they are doing. There was a time when very few traders had even heard of Fibonacci, but it has now become a very fashionable analysis technique, widely followed, particularly in the forex market and indices. It is quite possible that markets follow these Fibonacci patterns purely because so many players are fixated on these levels.
Whatever the reason Fibonacci works – I know that these levels do work, and that prices follow these patterns again and again, which is why I use them.
The ratios
The standard Fib ratios are 0.618, 0.382 (usually expressed as percentages, 61.8% and 38.2%) and the Gann ratio of 50%, which is often stated incorrectly as a Fib ratio.
I also use the so-called ‘Secret Ratios’ that apply to the Forex markets in particular (I’ll save those for a later date).
As we’ve seen, a major trend does not move in a straight line, but has a series of corrections or pull-backs. The basic theory of Fibonacci trading works by considering where prices might pull back to as the major trend undergoes a correction or rally.
These counter-trend moves occur for a variety of reasons, from traders booking profits along the way of a big move to other players deciding the main trend has turned, to short-term counter-trend traders catching what can sometimes be explosive snap back moves from an overbought or oversold market. These ‘jobbing’ trades are used by funds where the major holding is with the longer term trend and counter trend trading provides protection and profits as the correction takes its course.
Knowing the causes of these trends is one thing – but what traders really need to know is where and when the market will make these twists and turns – because that’s how we can nip in a take our profits.
What you need to know about retracements
The image here shows a simple Fib Grid with a counter trend move that turns at the 78.6% line.
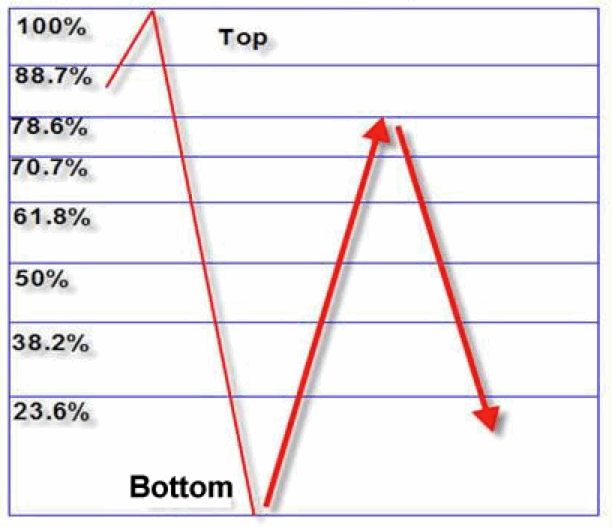 The major trend is moving from the top of the grid to the bottom, with the recent low representing 0%, and the recent high representing a 100% retracement.
Between these two extremes, the Fib Grid gives us a range of levels at which the price might retrace to.
What I’d like to show you is the simple range of patterns that build up in this range – and how you can use this information to predict where to get in and out of trades.
Many stock traders will tell you that a retracement must turn at or before the 61.8% level for the main trend to continue. Otherwise, they’ll tell you, it means that the main trend has run out of steam, and we can expect the 100% level to be taken out.
In my extensive experience and research, this is not so.
Retracements are often very deep with turns occurring at the higher Fibs, and often reaching the 88.7% level before turning tail and resuming the main trend. Indeed, there are some specific chart patterns that play out in the market that confirm themselves by turning at 78.6% or 88.7% – these are the Gartley and Bat patterns that very often result in a major reversal – I explain how these work in PART TWO.








2 comments
Ranj
Thank you kindly. Very interesting and just like Mark above I will be eagerly awaiting next weeks installment.
Mark Rose
Big thanks to you George for a great explanation. I’m looking forward to checking out your next tutorial on Friday.