March 29, 2013by Mark Rose- 0 comments
What is hidden divergence?
Use this hidden clue for perfect trend-following entries …
When we think of trading indicators, we tend to click on a button on our trading platform or charting package, and up pops a new line on our screens.
Of course, anyone can do that – which means that millions of traders will be looking at exactly the same indicators and watching exactly the same signals.
But what I want to look at today is a hidden clue within those indicators – something that most traders simply aren’t looking for.
And once you know how to spot this hidden clue – you’ll be one step ahead of all the others who have missed it.
Thanks to Philip …
Earlier this year, I wrote to you about how divergence can help to tell us when a trend is running out of steam. After I sent out that message, a Bulletin reader contacted me about a different kind of divergence that I’d completely overlooked in that email.
It was a helpful nudge – and I’m going to address it here.
It’s called “hidden divergence” and it’s lurking in our charts all over the place.
In fact, it can be incredibly useful to a trader, because, instead of trying to pick out turning points (a notoriously difficult task in trading) – it tells us that a trend is gathering strength.
This means we can ride trends. So, not only is this an excellent tool for your trading kit – trend-following strategies tend to be the safest and most successful out there.
So, how do we find this “hidden” clue?
First off, let’s have a quick reminder of what “classic” divergence looks like, and what it tells us …
Most technical indicators, like oscillators, will mirror the price movement – if the price goes up, our indicator goes up … if the prices moves down, our indicator heads down … when prices peak, indicators peak … when prices bottom, the indicator bottoms …
You get the picture.
It’s all pretty obvious, but it’s not very helpful at getting us in on any movements early.
When things get interesting is when indicators give us a story that is at odds with what the price is doing. This is called “nonconfirmation” – and that’s what we find on overbought/oversold indicators in the form of “divergence”.
In the example shown here, we have the price trending upwards, but the RSI reading has formed a lower low. So it’s telling us that this trend is running out of steam.
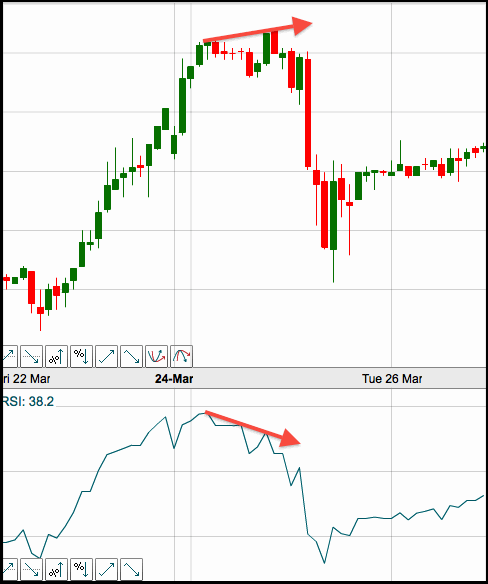
The same can be seen in a downtrend, if the price is forming lower lows, but the indicator shows a higher low. It tells us that a change of direction may be imminent.
So, that’s classic divergence – but we want to find a strategy that FOLLOWS trends, not one that tries to pick tops and bottoms.
In trading, a cardinal rule is that the trend is our friend. Any strategy that’s trend-following automatically gets a head-start.
But the trick with any trade, whether it’s trend-following or reversal, is finding a good entry.
With a trend-following strategy, the best place to get in is on a pullback – that way you can maximize the move you ride.
And hidden divergence is found in exactly this place – the pullbacks.
So, in an uptrend, instead of watching what the highs are doing – we’re watching what the lows (the pullbacks) are doing.
And in a downtrend, instead of watching what the lows are doing – we’re watching what the highs (the pullbacks) are doing.
Here’s an example taken from USDJPY, a currency pair that has been trending strongly upwards this year.
I’ve highlighted on this chart one instance of bullish hidden divergence, but there are plenty of places where a pullback on the price has give us a higher low, while the RSI has given a lower low.

It’s exactly these kinds of pullbacks that give us a good opportunity to get in on a trend – because they are telling us that the trend has momentum and still some way to go.
In theoretical terms, what this signal is telling us is that, despite the price moving higher, the market sentiment is that it is more oversold.
And it works for confirming downtrends, too …
In this example, I’ve looked at the same chart, but further back, when the USDJPY was in a long-term downtrend.
Here I’ve highlighted some key points where you could have jumped on board this trend – the price has pulled back upwards to form a lower high, but the oscillator tells us that, despite a lower price, the market is relatively overbought.

The third instance of hidden divergence that I’ve marked on this chart shows that divergence can still be found if the price is forming a lower high, but the indicator failed to move lower (i.e. the indicator’s highs stayed at the same level).
Where to look …
There’s nothing magical about hidden divergences on RSI indicators – they can be found on any overbought/oversold indicator, or one that oscillates around a zero level.
But it is well worth training your eye to spot them – because few things are more frustrating that watching a trend run and run without you – and not knowing where to jump on board!