How to trade divergence (plus my FREE divergence cheatsheet)
If you’re not familiar with it, divergence can take a bit of help to get your head around lower lows … higher lows … what’s bullish … what’s bearish …
But fear not – with this simple how-to, plus my downloadable cheat sheet, you’ll learn to trade divergence and become a pro at reading oscillators.
Where to look …
Divergence can be found on a range of oscillators: RSI, MACD, Stochastics, Momentum, and more.
For simplicity, I’ll just look at the relative strength index (RSI), but you don’t need to restrict yourself.
What is divergence?
Divergence occurs when price action does one thing, while the oscillator moves the other way. But rather than just looking at gradient, we want to see trending behaviour – so we’re looking for higher highs (HH), lower highs (LH), lower lows (LL), and higher lows (HL) – don’t worry, it’ll all become crystal clear in a moment!
What’s so good about trade divergence?
The most basic way to use oscillators is to take overbought and oversold signals. In the case of RSI, if it’s over 70, the price is overbought and you should sell; if it’s under 30, the price is oversold and you should buy. However, prices can continue to trend long after these extreme RSI levels are hit, so it’s a notoriously unreliable way to use an oscillator. What’s better is to watch the direction of that oscillator compared with the price.
While I should be careful to point out that nothing can predict prices, by trading divergences we can get some insight into changes in sentiment so we get clues that prices could be about to change direction or continue in a direction. Divergence makes an excellent trade confirmation tool, and can help us get into trades earlier, at better prices. It also makes a great early warning system to jump out of trades that are running their course.
There are two main types of divergence, plus a third form that you can watch out for, but which is less reliable …
Regular divergence
Regular divergence acts as a warning that the momentum in a trend is running low and that we could be about to see a reversal. For a trend trader, this is most useful for telling us to take profits.
When measuring regular divergence, in an uptrend, we’re looking at the new highs the price has hit, so we’re drawing a line between the highs. In a downtrend, we’re looking at the price lows, so we’re linking the lower lows.
Here’s an example of the price hitting higher highs, while the RSI hits a lower high …
So, what’s going on here?
As long as the price and our momentum indicator (RSI in this case) are in the same direction, it suggests that all is well with our trend. But when the price hits a new high, and the oscillator does not, it suggests that momentum is fading. We could be in the early stages of a momentum shift (this is most powerful when we’re in overbought/oversold territory). A momentum fade like this can be used as a sign that prices are about to turn and this information is particularly useful for the trend trader who’s wondering when to take profits.
Here’s an example of the same type of regular divergence, but in a downtrend …
While the price is continuing to move lower, the RSI indicator is showing momentum pulling in the other direction. This suggests that the downtrend is running out of steam and the price could be about to see a reversal. If you’re in a short position, this could be a good opportunity to take profits.
So, regular divergence is seen in the new highs of an uptrend, or new lows of a downtrend, and warns us that all may not be well with the current trend.
While regular divergence suggests potential reversals, hidden divergence hints that a trend is about to resume …
Hidden divergence
For a trend-follower, regular divergence is most useful as an exit prompt. However, hidden divergence offers a confirmation that a trend is about resume after a pullback and a good opportunity to enter a trend.
Unlike regular divergence, hidden divergence isn’t looking at the extremes in a trend (i.e. the higher highs/lower lows), but the pullbacks. So, in an uptrend, we’re linking the higher lows. In a downtrend, we’re watching the lower highs.
Here’s an example …
If we think about the RSI in terms of ‘oversoldness’ here, what we’re seeing is that the second price low is higher than the first, but it is giving a more extreme oversold reading. This implies that market sentiment will want to drive the price back up, resuming the uptrend.
Here’s an example in a downtrend …
A lower high on the price is paired with a higher high on the RSI. The implication of this set-up is that the price will drop, resuming the downtrend (which it does).
Hidden divergence can be really useful for a trend trader looking for an entry on a pullback, so is well worth looking out for.
I appreciate that remembering these set-ups can be tricky when you’re sat in front of your chart watching live action play out, so you can find quick prompts in my Divergence Cheatsheet, downloadable here.
The final type of trade divergence, is called exaggerated divergence.
Despite its name, this is really the poor relation of regular divergences, when the price and oscillator diverge, not going in opposite directions, but one is flat (or relatively flat), while the other is trending.
In the example below, we can see exaggerated regular divergence. The price is trending lower, but the new lower low has the same RSI reading as the previous low.
The implication here is that the momentum is shifting against the trend and that a reversal could be imminent.
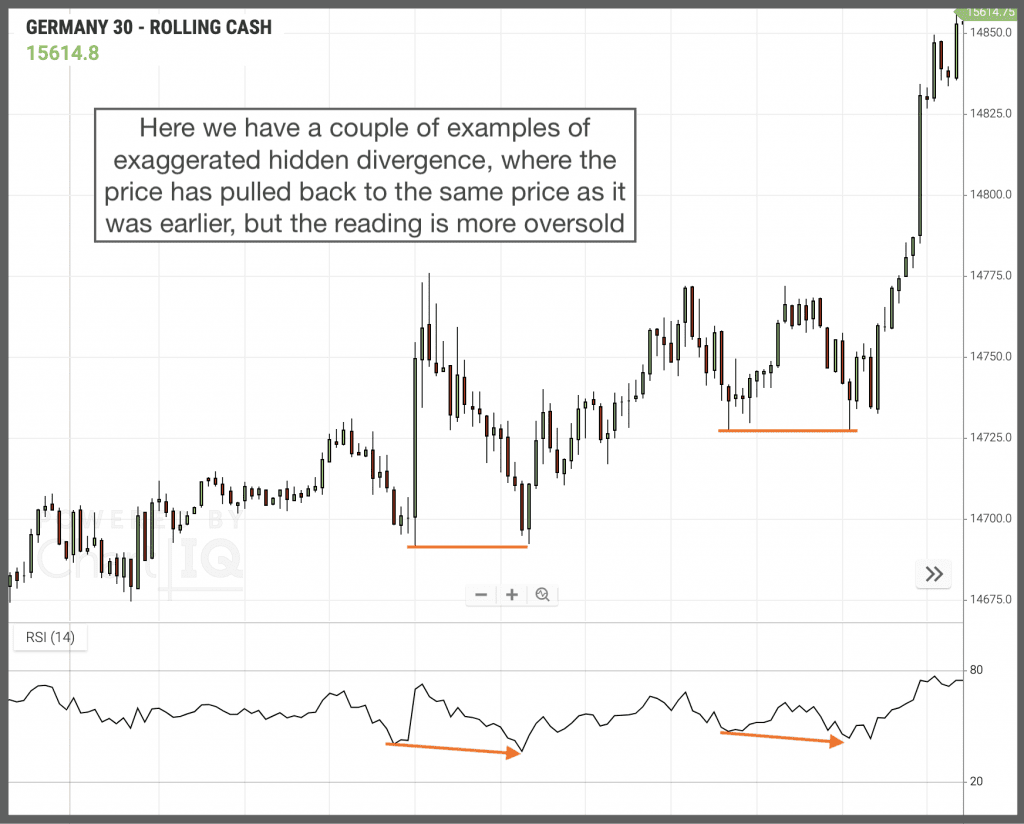
Exaggerated divergences can also be seen in hidden divergence …
In the next chart, we have two instances of the price pulling back to a previous low in an uptrend. In both instances, the RSI has given a lower reading, suggesting the level is more oversold and that the trend will resume …
In exaggerated divergence, either the price action or the oscillator can be flat – what matters is that the two readings divergence. Because the deviation is less extreme, these signals aren’t as strong.
How momentum can unlock profits
Divergence on its own doesn’t constitute a signal to trade, but understanding momentum and being able to read divergences give us the know-how to get the best trade entry and exits.
Mastering momentum divergences allows us to get into trends on the pullbacks, just as they are about to accelerate away. And it enables us to jump out of trends just ahead of a pullback. What more can a trader ask for?













2 comments
Ray
Thank you, Mark, a most useful summary of this baffling item! And a useful cheat sheet!
Mark Rose
Thanks Ray – pleased you’ve found this helpful