December 4, 2015by Mark Rose- 2 comments
THIS is how to read oscillators
There’s no shortage of oscillator indicators to choose from.
And, for every oscillator, there are a bunch of different ways to apply its wisdom to your trading.
Many novice traders prefer to ignore these indicators altogether, because the wobbly line at the foot of their chart causes more confusion than anything else.
So, which is the best oscillator to use? And what is it actually trying to tell you?
The maths behind trading indicators is normally pretty complex, which can lead us to think that they must have some mystical predictive powers …
But oscillators can’t tell us what’s going to happen next – it’s important to remember that they are just an indicator of how far and fast the market has moved. Yes, this can give us some excellent clues about future behaviour, but it’s not a magic crystal ball!
So, if we keep oscillators in perspective, we’ll be better at reading them.
If they are telling us how far and fast the market is moving – they give us hints about whether a correction is due … about whether now is a good moment to get into a trend (because it’s strength is growing) … or whether now is the moment to jump ship, because the trend is running out of momentum …
Most oscillators will give us over-bought signals … over-sold signals … divergence … hidden divergence … some have crossovers …
… and so the confusion begins.
I’m going to start here with a simple one-line oscillator, called the TRIX indicator.
The reason I’m looking at the TRIX is because it’s nice and simple, with just one line to worry about, and it’s great at reducing market noise – it’s a very smoothed-out oscillator, compared to the jagged, jumpy lines of something like an RSI.
This makes it simpler to read what the oscillator is telling us – is the market move gaining momentum, or running out of steam?
However, the signals we’ll look at here can be found on all oscillators – you may prefer one that is more reactive than the TRIX … or you may want one that has two lines …
But I’m using the TRIX indicator as a back-to-basics oscillator …
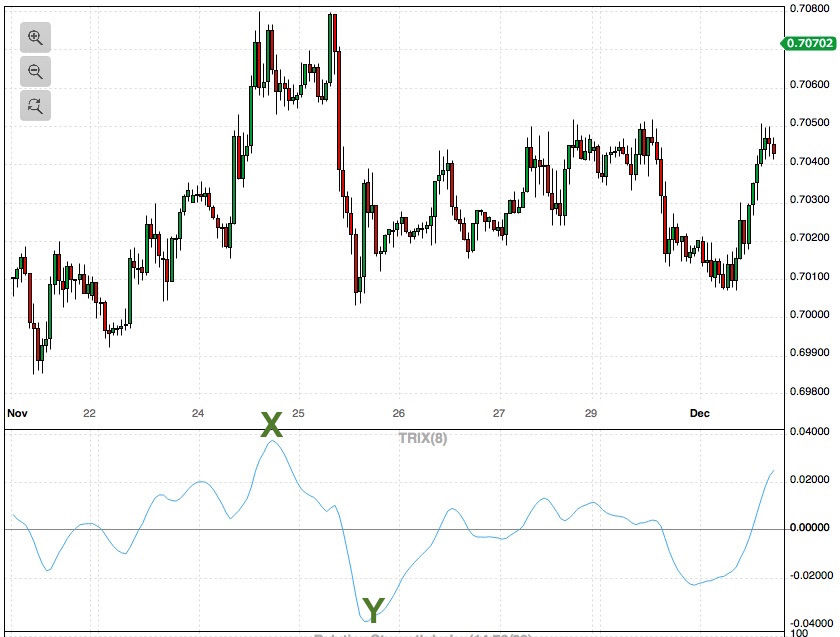
Above, you can see that the oscillator generally moves in tandem with the price – as the price moves up, the oscillator moves up … when it moves down, the oscillator moves down.
When the oscillator hits extremes, it tells us that the price is relatively ‘overbought’ or ‘oversold’ – as we can see at X and Y above. But, be warned, these overbought or oversold conditions can last a while, so this isn’t the most reliable message that the oscillator gives.
Instead, I want to look at oscillator divergences – these are fantastic predictive signs in our charts. Once you know how to spot them quickly and easily, you’ll always want an oscillator on your chart.

Above we have 3 instances of divergence …
A: this is called hidden divergence, because it’s looking at the pullbacks on a trend, rather than the new levels hit. The price is moving up in a trend, creating a series of higher highs and higher lows. However, at A, the oscillator is showing a lower low. This tells us that this pullback is making the price look – relatively – oversold. Therefore, we can expect an explosive move higher from this level.
This kind of hidden divergence is a gift to anyone looking to jump into a trend that’s already established, or wants to add to a position they’re already holding.
B: Here we have a double top forming, and the oscillator level for the second top is considerably lower than for the first. If you’re still bought into this market, this should flash warning lights at you that the trend has run out of steam.
C: This is the standard type of divergence – the market is forming a series of higher highs, but the oscillator has tailed off – making lower highs. These diverging trend lines again warn us that this trend has run out of steam, and the price is due to drop (which it duly does).
The trick is to intuitively spot when the oscillator is moving at odds with the price, because it’s giving you a clear sign that the trend you’re watching might be about to turn tail – or about to shoot ahead.
Find an oscillator that has the kind of sensitivity that suits your trading – if it’s too sensitive, it’ll jump about all over the place – if it’s too smoothed out, you might not get the signals you need. I recommend a little play around with a few until you find something that suits – and then stick with it, getting to recognize it’s swings.
And finally, let me know how you get on with oscillators …










2 comments
Laurie
Thanks for the reminder Mark:) The oscillator is the “big brother” which overrides what the price is currently telling us. As in example C, the price is rising but is actually running out of steam as highlighted by the dropping levels of the oscillator. Good stuff and a nice one to put on the charts.
Paul H
Very useful. Divergences are one of the very few ‘leading indicators’ around. I like to draw channels on price and trade the breakouts.