February 1, 2016by Mark Rose- 0 comments
What is technical analysis?

What is technical analysis, and does it really work?
Traders tend to be bracketed into two camps: the technical traders, and the fundamental traders. The first focus on their charts … while the second scour company reports and financial news.
Technical analysis uses a host of indicators (and new ones are constantly being invented) – from simple moving averages, to more complex patterns like Ichimoku clouds and Elliot Waves.
The internet is littered with forums where the two camps battle it out – and there’s no shortage of people who’ll tell you that ‘technical analysis doesn’t work’.
For myself, I can clearly remember the first time I was shown how to use technical indicators on my charts to predict future price action – and I remember thinking that it seemed crazy to believe that drawing some lines of a chart could give you mystical predictive powers!
So, are technical analysts just fantasists with a penchant for witchcraft and divination?
It’s understandable that technical analysis gets some bad press.
It would be nice to get a straight answer – is the market going up or down? Has this trend reached its conclusion? Will it rain tomorrow?
Surely that’s what these theories are there to tell us?
Technical analysis allows us to look at price patterns in the past, and use what happened before to make judgements about the future.
An exact science it is not.
I like to use the phrase: history doesn’t repeat itself, but it does rhyme with itself.
And it’s a good maxim to remember when you’re looking at your charts.
Technical traders often put too much faith in their indicators, and are then crushingly disappointed by them. Technical indicators are a tool to help us read the information on our charts more easily – nothing more.
So, which technical indicators work best?
Yes, I do have some favourite technical indicators, but it’s impossible to say which ones work, and which don’t – it’s all in how you use them.
Some I find more intuitive.
Some, like moving averages are wonderfully simple.
Some, like Ichimoku clouds look very complicated, but actually give lots of information all wrapped into one indicator.
And, of course, there’s the candlesticks themselves, and the patterns they form.
The principles of technical analysis
If technical analysis is based on the idea of history repeating itself, then it requires us to look for patterns in the past that we can then apply to the current price behaviour.
This involves examining price charts.
1. Lines of support and resistance
If the price has struggled to move through a certain price point in the past – it stands to reason that it may struggle at this level in the future.
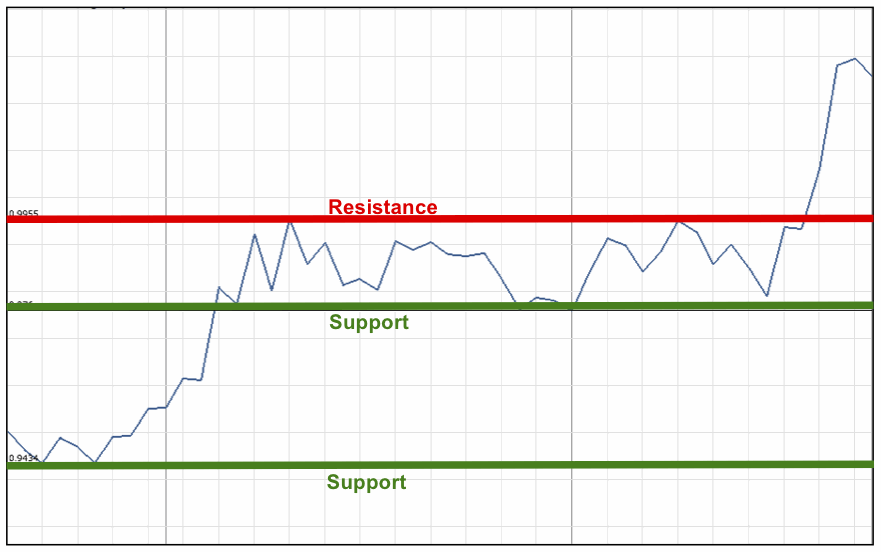
When a price meets an area of resistance, this tends to be where traders decide to take profits, so they sell, and the price is forced lower again.
Likewise, when it meets an area of support, this is where traders think they can buy up cheap – and prices are forced back up.
Of course, it doesn’t always happen like this – but we do see prices behave this way at key levels again and again. And it’s the premise of technical traders to take advantage of this price behaviour.
2. Price patterns
There are hundreds of different price patterns you can learn to recognise, from cups and handles, to the ‘vomiting camel’, but the example I’ll show you here is one of the most reliable: a double top …

The double top is an excellent reversal signal, that the price has reached a high, and will now be heading lower. The patterns is formed once the ‘neckline’ shown on the image above is breached.
3. Indicators
There are enough technical indicators out there to make any self-respecting trader run heading for the hills. And each indicator has tombs written on how best to use it, with opinions varying from one trader to the next.
So how on earth do you decide what to use, and how to apply it?
In the articles on this website, you’ll find many, many indicators explained, plus simple strategies showing how to apply them. Yes, you’ll find many people who use them differently, but it’s my belief that successful technical trading is about learning how the indicator you’ve selected ticks – they all have their weak points, and when you know where your indicator is likely to let you down, you’ll learn when to listen to it, and when to take a step back from the markets.
I recommend you start with the Trader’s Bulletin Learn to Spread Bet course here.
Save