August 3, 2012by Mark Rose- 0 comments
Does technical analysis work?
I may be a technical trader at heart, but, when it comes to the crunch, I’m a pragmatist – I’ll go with what works.
So, if you’re sick of trying to decipher what your Macd reading is, or waiting for your moving averages to cross – you could be tempted to throw out all your technical indicators.
Check out any trading forum and you’re bound to find a dozen threads where traders are debating the merits of technical analysis.
Technical analysis is dead … it doesn’t work … price action is king …
These debates just seem to go round and round in circles, with traders bad-mouthing each other’s methods.
In my opinion, they’re all missing the point.
All technical analysis is is a way to interpret price action. It’s supposed to be a useful shortcut, to make charts easier to read.
The problem is that technical traders (myself included) can too easily fall into the trap of holding too much store in their indicators. We endow them with some kind of mystical powers of prediction.
Technical analysis is a tool – and nothing more.
How to measure momentum
Let’s look at something simple like momentum – one of the most basic pieces of technical analysis. There’s nothing complicated about the maths behind it – there are a few ways to calculate it, but a common way is that it’s the most recent closing price, compared to the closing price X periods ago, shown as a percentage.
In layman’s terms – it’s a measure of how far the market has moved in X periods.
Traders use momentum to measure the strength of a trend, up or down.
A high momentum reading tells us that the market is rising rapidly.
A low momentum reading tells us that the market is falling rapidly.
We don’t really need an indicator to tell us how fast the market is rising or falling – we could just look at our charts. We can look at how big our candles are … and what direction they’re moving in.
In fact, for the bulk of the time, the momentum indicator just follows along with the pattern of our price charts – not really telling us anything we don’t already know.
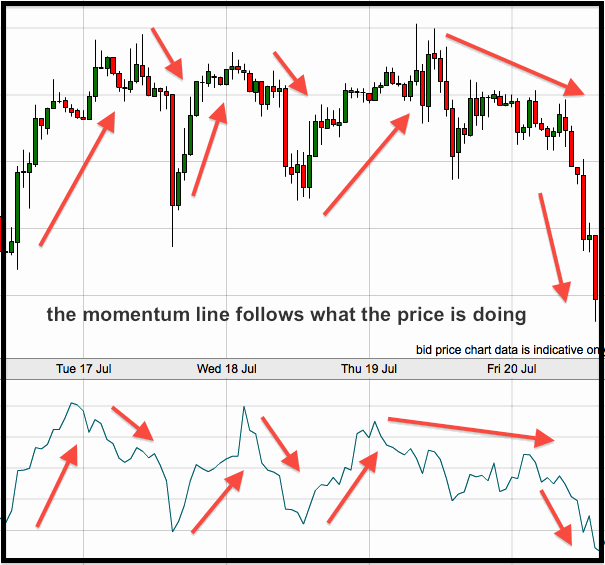
In this chart, we see the price for the EURUSD hitting three highs, before the price falls back considerably lower. The momentum indicator below it does much the same thing – so it really isn’t giving us any extra information. Right?
Well, let’s take a closer look at those three highs …
On the price chart, the third high is the highest, which suggests that we’re in an upward trend.
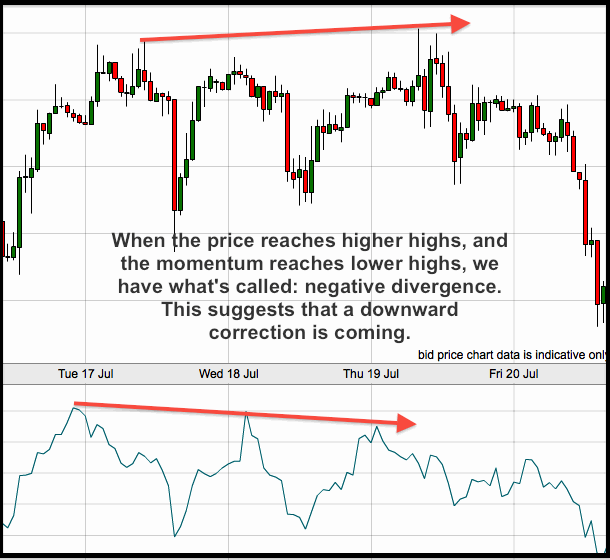
However, now take a look at the momentum indicator below … these three highs are getting progressively lower. This, by contrast suggests that this rally is running out of steam.
And what happens … we have a period of consolidation after the final high, and then the price drops away.
The indicator isn’t showing us any mystical powers – it’s just telling us how far the price has moved over the past 12 hours. You could get this same information by looking at the size of your candles. There are no rules about what’s better or worse – just preference. Price charts and indicators are here to help us, so we should use them in the ways we find best.
Here’s another example where the momentum indicator gives us some useful clues about where a trend could be running out of steam …
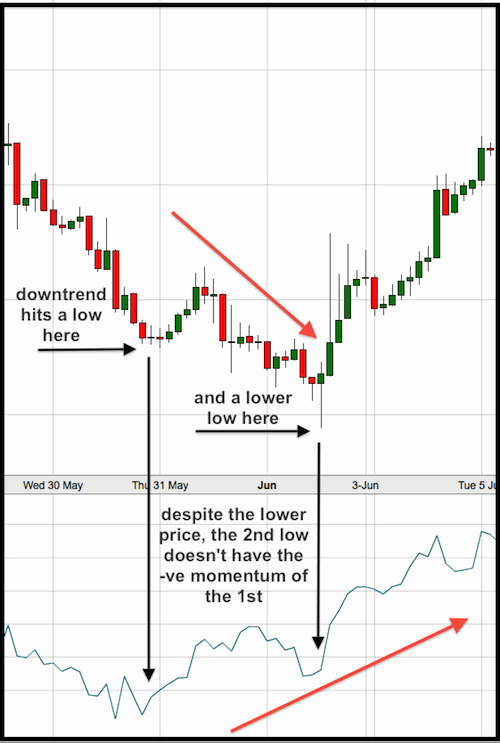
(NB: Apologies for the lack of plain speak on my labels – by “doesn’t have the -ve (negative) momentum”, what I mean is that it’s higher!)
The reverse situation is happening here – the price is hitting lower lows, telling us that we’re in a downtrend – but the momentum is rising (or has less “negative momentum”!).
This rising momentum suggests that the market is becoming more bullish. This is called positive divergence.
Trading bareback
Even a hardened technical trader like me can appreciate the value of going indicator-free occasionally.
It stops me getting bogged down with conflicting signals … and reminds me that trading needn’t be as complicated as we sometimes make it for ourselves.
So, if you fancy a bit of “naked trading” (so to speak) – make sure you read Martin Carter’s excellent article on dynamic trading here [LINK].