The belt loop trade has nothing to do with how you wear your jeans. Whether you like them keeping your kidneys warm, or swinging around your knees … the markets don’t care …
One of my bug bears with candlestick patterns is how frequently they crop up. If a pattern is littered all over your charts, just how helpful is it? And if it crops up once in a blue moon, you’re not going to get many profit opportunities from it.
But the belt loop, or belt hold, is a good balance.
It pops up regularly on charts, without being ubiquitous.
It also gives us a good stop level, so we can get out quickly if the pattern is broken, meaning that we can manage our risk carefully in belt-loop trades.
Recognizing the belt hold candle
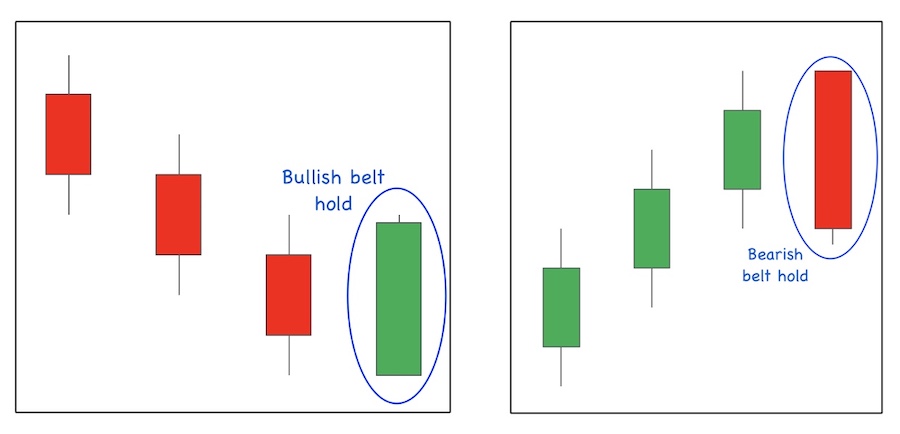
A bullish belt hold candle appears in a downtrend; it is a green candle with a long body, no lower wick, and a very small upper wick. The bullish belt-hold is sometimes formed just after a gap down in the price.
A bearish belt hold candle appears in an uptrend; it is a red candle with a long body, no upper wick and a very small lower wick. The bearish belt-hold sometimes forms just after the price gaps up.
The longer the body of the candle, the stronger the buying or selling power it indicates.
This is a short-term pattern, telling us that the current direction could be coming to an end.
As with all candlestick patterns, it works best combined with key levels, so ideally we’d have the bullish belt hold candle forming on an area of support, or the bearish belt-hold formed on an area of resistance.
They are also easy candles to spot, as they’ll be large, and should form the end of a downtrend or uptrend.
How to trade the belt-loop
When trading off these candles, bear in mind that the large size of the candle is an alert signal – volatility has increased. This means that we could collect a fast, easy profit … but it also means that a stop can be vulnerable if the price has a ‘wobble’.
So, how should we position our stop levels?
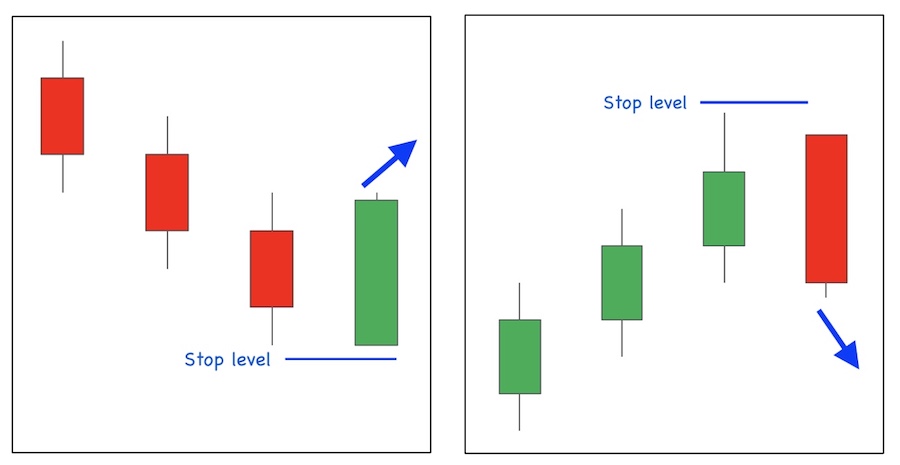
In the case of a bullish belt-hold, the recent low could be the opening price of our belt hold candle. However, it’s possible that the previous candle has a wick that juts down below this. Either way, look at the lowest low hit by these two candles, and add a couple of points of wriggle room when setting a stop level.
Likewise, if you’re trading off a bearish belt-holt, the recent high could be the open price of the candle, or maybe the previous candle will have nudged higher than that. Pick the high of those two candles, plus a bit for your stop level.
The belt hold candle pattern is a short-term reversal signal, which means that we’re anticipating the price to change direction. The best way to get the maximum move from this kind of correction is to be trading in the direction of the longer term trend.
What this means is that we’re looking for a belt-hold pattern marking the end of a retracement – telling us that we can jump back into the prevailing trend.
Belt-hold Trade Example 1
Here we have a short-term up-swing as the price retraces during a downtrend. At the top of this retracement, we have the green doji candle, followed by the belt-hold, before the price accelerates downwards.
Belt-hold Trade Example 2
In this second example, again, we have a belt hold candle signaling the end of a retracement, and again we see the price accelerate downwards. This is followed by another retracement, which fails to break the resistance level set by the belt-hold candle.
Belt-hold Trade Example 3
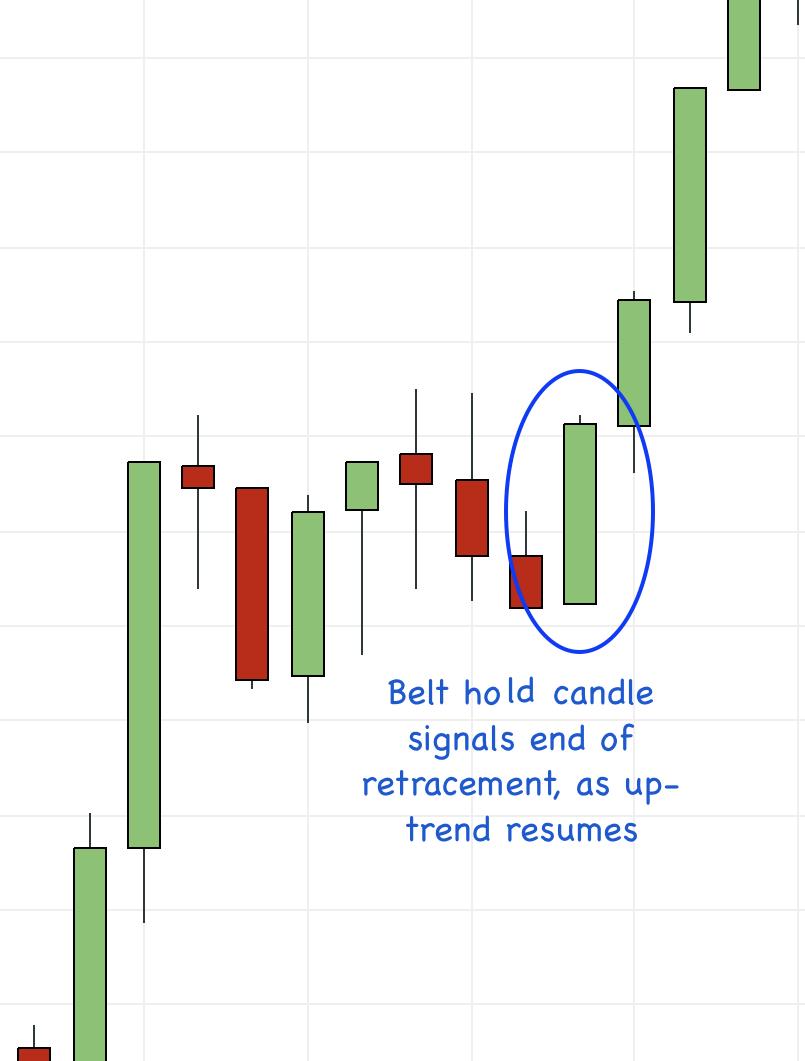
This time, the prevailing trend is upward, with the bullish belt-hold candle marking the end of a period of consolidation and signaling an opportunity to get into this trade ahead of a strong surge in the uptrend.
As I mentioned at the beginning of this post, one of the great things about these belt hold candles is that they crop up again and again, meaning that we can find these kinds of opportunities regularly. Of course, sometimes the signal will let us down (no trading signal is infallible), but a nice secure stop level means that we can quickly cut losses if the belt loop doesn’t hold.
I recommend that you take a look at some charts and get used to spotting this candle – I believe you’ll find it a useful tool for trade entries and stop placement.