Many
traders think they know what a doji candlestick means … but it’s widely
misread.
Here I want
to show you how to spot 2 types of doji … and to recognize exactly what they
are telling you about market conditions.
Once you
understand this, you won’t need to ‘spot patterns’, because you’ll understand
what market sentiment is, and you can quickly see how to use that to your
advantage.
So, what’s a doji?
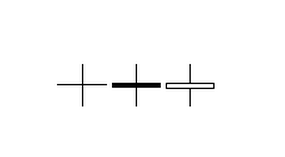
A doji is a type of candlestick in which the price opened and closed at exactly, or very close to, the same price it opened at. This means that the body of the candle is non-existent, or very small. The wicks can be long or short, but the appearance of the candlestick will be something like a ‘plus’ sign …
The doji shows that the price went up … it went down … but ultimately
the buying and selling pressure from traders cancelled out, ending up at the
same level it began at.
Text books will tell you that this means indecision in the markets.
But I want to show you different types of doji, and how they can point
us to profit opportunities.
Putting a doji in context
Candlesticks tell us very little on their own – they need to be viewed
in context to the candles that have come before them.
A lot of traders will recognize a doji as a market reversal sign – I’d
urge you to be cautious of this view.
Take a look through some charts, and you’ll often spot a doji sitting at the top or bottom of a trend reversal.
Those long, spiky wicks, sticking into empty space on our charts, jump
out at us visually … but this is the result of looking at price action in
hindsight. When we don’t actually know what’s coming at us from the right-hand
edge of the chart, we can’t know if the price will reverse, and there’s no
shortage of dojis that form in the middle of a trend.
Take a look at the downtrend on the same chart, where a doji candle forms, right on an area of support …
A trader looking for a reversal signal could easily take this doji as a
sign that the price is about to change direction, so it’s important to recognize
that a doji is actually more likely to be a moment of hesitation before the
trend continues, and it’s to be expected that the price could hesitate on a
level of support like this.
So, if a doji doesn’t tell you which way the price is going, what do
they do?
Now I want to show you the subtle differences in 2 types of doji, and
how to read the profit potential in each …
The Dragonfly Doji
The basic anatomy of a candlestick, which I expect you’re already
familiar with, is that the body of the candle represents the difference between
the open and the close price of that period (red or black if the price has
moved lower; green or white if it’s moved higher), and the wicks show the
extremes the price has reached in that period.
Each candle is a tiny picture of hope, of profit-taking, of greed, and
of fear. All these market emotions can be read in those few lines. When we
start to see candles as ‘stories’ they become hugely powerful.
So, what is the dragonfly doji, and what is its ‘story’?
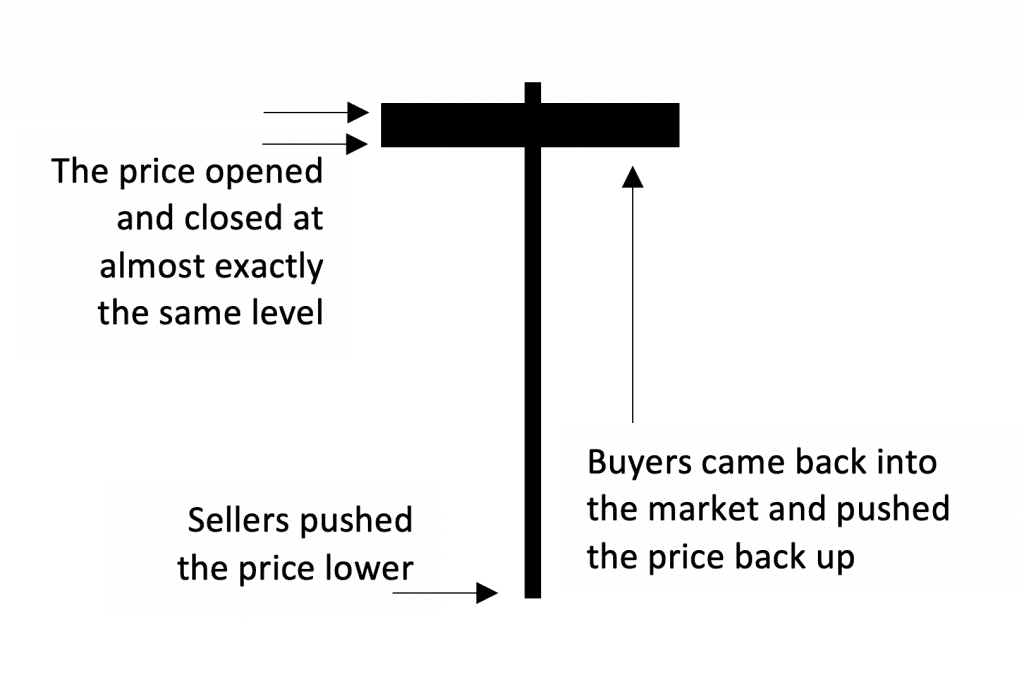
A dragonfly doji opens and closes at the same level, and has a long lower wick, with no upper wick. It’s a pretty rare occurrence, but it’s cousin, the hammer, can have a small body and a small upper wick …
The story of the dragonfly doji is one of market optimism, with buyers
dominating over the sellers.
It’s a very bullish candle, but – as always – it needs to be read in
context.
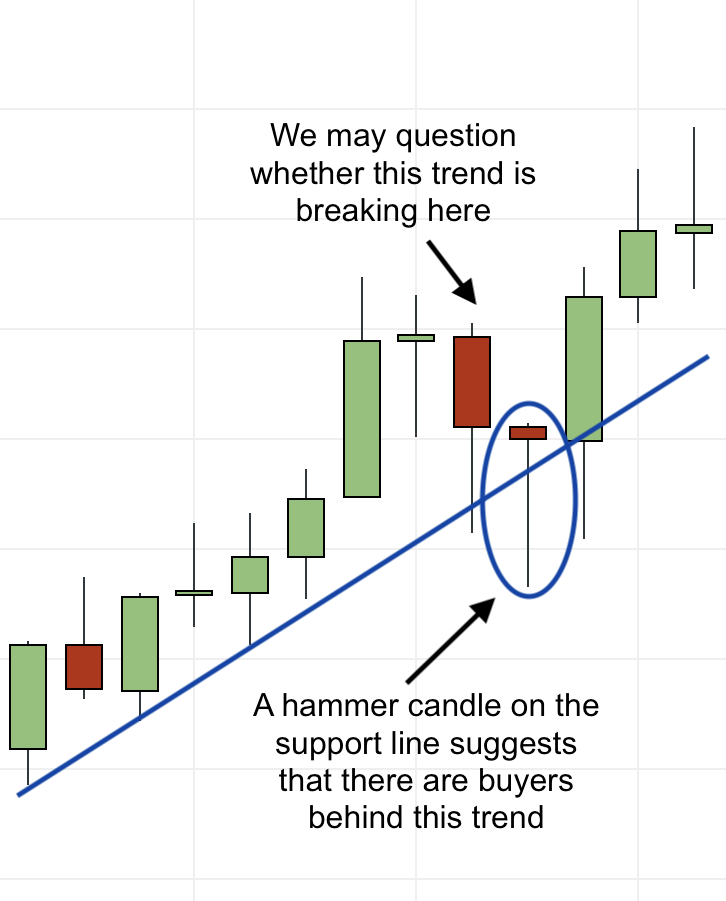
The combination of a dragonfly doji and a level of support would be an indication that the doji ‘hesitation’, is going to result in an upward move.
The bullishness of the doji/hammer candle doesn’t have to mean a reversal – it can equally confirm a continuation of the trend …
Strictly speaking, when this type of candlestick appears in an uptrend,
it is called a
‘hanging man’ (I don’t like to
get too hung up on names and classification – this is about reading what the
candle shape is telling us), and there’s much information out there to tell you
that a hanging man is a reversal signal. In my experience, that just isn’t the
case, and it’s more likely to be followed by a continuation.
(If you want a fact-check on candlestick patterns, I recommend checking
out thepatternsite.com, where Thomas Bulkowski has published a huge amount of
research into the effectiveness of different patterns.)
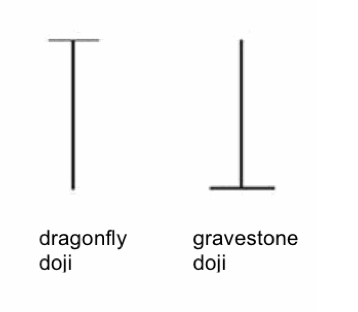
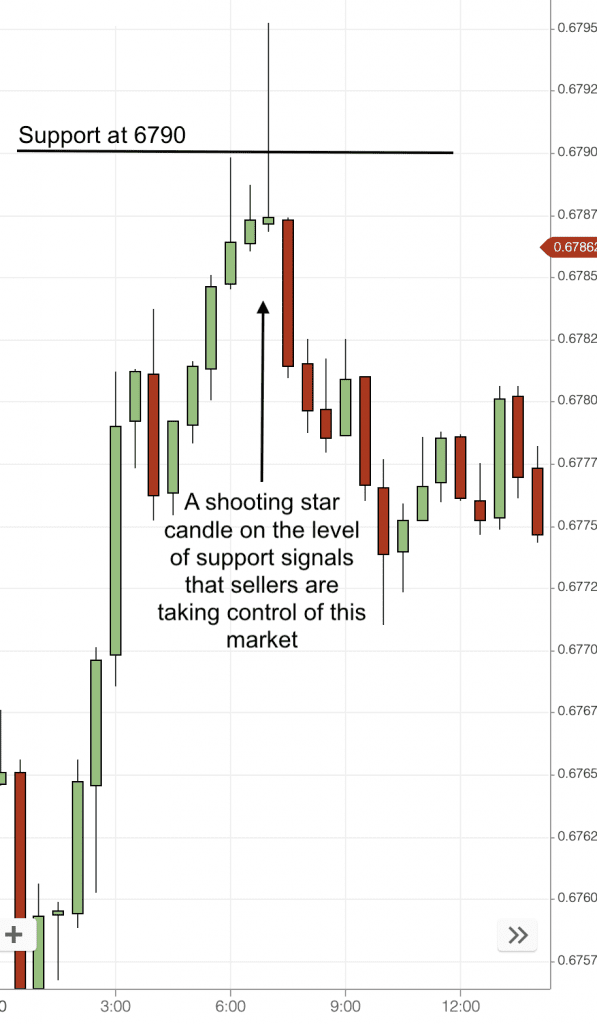
The opposite of the dragonfly doji is the more somberly named, gravestone doji …
For the gravestone doji, and its more common cousin (with a small body
and small lower wick), the shooting star, the story is one of sellers
overcoming buyers.
For this doji, at the beginning of the period, buyers push the price higher, before sellers take over, dominating the market and pushing the price back to its starting level. This makes this a bearish candle.
The same shaped candle can also appear in a downtrend (official called an inverted hammer here, and officially a reversal signal) …
The next doji I want to show you is the long-legged variety … but I’ll
save that for another day.
In the meantime, here are the key points to
take about dojis …
• Beware assuming a doji means price is reversing. Trends continue more
often than they reverse.
• The longer the timeframe, the more powerful the doji (consider how
unlikely it is to close on the same price as we opened after an hour, vs after
just 5 minutes).
• Because of the indecision inherent in the doji, waiting for a breakout
of the full candle (including wicks) before confirming a direction is
advisable.
• Don’t worry about classifying your candlestick or learning its name. Instead, focus your attention on the length of the wicks – ask yourself whether buyers or sellers are in control here. The longer the wick, the more powerful the story of your candlestick.