The
long-legged doji doesn’t come along very often, but when it does, it brings
with it a stack of key information in a very neat package.
If you read
it correctly, you can collect some neat profits off the back of it.
How to spot a long-legged doji
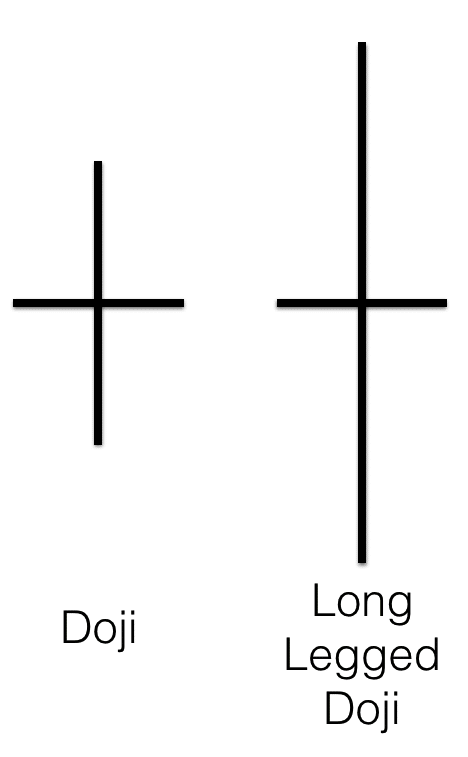
As we saw last week, a doji is a candlestick with a very small or non-existent body. This means that the open and close price of the period should be the same, or within a few points of each other.
To count as a long-legged doji, the wicks of the candle should be long. So, it’ll look something like this …
There aren’t any official guidelines for how long the wicks on a doji need to be to count as ‘long legged’, but for me, a long-legged doji needs to be a spike in volatility.
So, I’d want the ‘legs’ of a long-legged doji candle to make this candle significantly bigger than recent candlesticks. Take a look at the example below, where the price volatility on the doji candle isn’t any greater than the candles before it …
This candle
may look ‘long legged’ at first glance, but we’re looking for a surge of
volatility in the market.
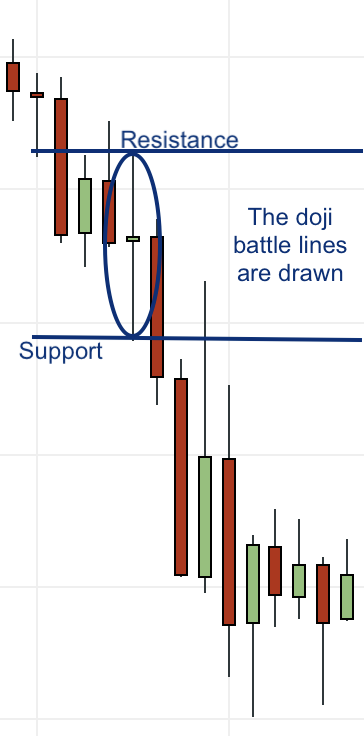
Compare this to the doji candle below, which (including its wicks) is noticeably larger than the candles before it …
So, what’s going on here?
Just as
with other dojis we’ve seen, the long-legged doji is about a battle within the
market between the buyers and the sellers. But for the long-legged doji, this
battle has been particularly fierce, covering a lot of ground, as the price has
been pushed higher and lower.
This
suggests significant volume at play, and tells us that the tips of the doji’s
wicks are clear price lines for traders. After the tussle – buyers and sellers
have ended up close to where they began.
The doji
channel
What this means is that our long-legged doji gives us a channel, with support at its low, and resistance at its high …
What we
have now is a channel – and we’re going to trade the breakout of this channel.
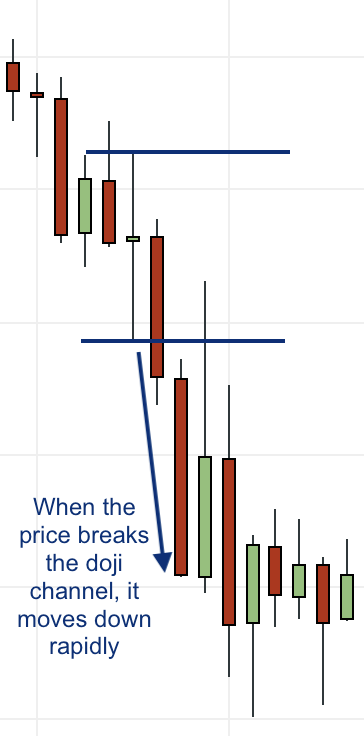
Because of the spike in volatility seen in the long-legged doji, we expect a surge of volatility when that channel is broken – and that’s exactly what we see in this case …
This isn’t
a move that we should hang around waiting for, nor one we should expect a huge
number of pips from. If we’re trading off a single candle, we can’t expect the
markets to remember our ‘doji channel’ for long! Within the next four or five
candles, we should see our surge out of the channel, and collect a quick
profit.
Beware volatility
The
long-legged doji profit is all about taking advantage of a surge in volatility
… but volatility can be a double-edged sword to those of us looking for a quick
profit.
If the
scale of your doji is very large, it could mean that news or data is causing
the price to move very quickly, so any order you set to buy at the top of the
doji, and to sell at the bottom of the doji could suffer from slippage. Watch
out for significant market-moving events which cause VERY long-legged dojis in
wild market conditions – these are best sat out of.
Also, be aware that volatility comes in fits and starts – the surge in volatility you see in the long-legged doji could taper off in the next candle, and you could see the price consolidate for a few candles before it makes its move. As I said above, don’t wait too long. But also, don’t worry if the price takes a small breather before the breakout.