Trading against the trend is the investment equivalent of swimming against the current. It can be done, but is making life a lot harder for yourself. So here I’d like to show you the best indicator to identify trend.
If you get
into the market with a trend, then that momentum can carry you into
profitability. Like flipping houses in a booming property market – you don’t
need to do very much to make money.
So, the
answer to profitability sounds simple – just trade with the trend, right?
We want to buy in an uptrend …
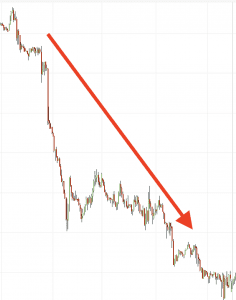
And sell in a downtrend …
But, as
ever, it’s not quite that simple. Because live market charts rarely look quite
like those above, and direction is always easier to spot in hindsight. Trends
turn, they stall, they retrace, and (like life) are messy.
So, I’d like to show you the best indicator to identify a trend – it’s a 3-step trick to ensure you’re always on the right side of the trend – and it involves no drawing of trend lines onto your charts …
Step one – big picture
The first
step is to use a long term moving average to give us a pulled-back view of
market direction.
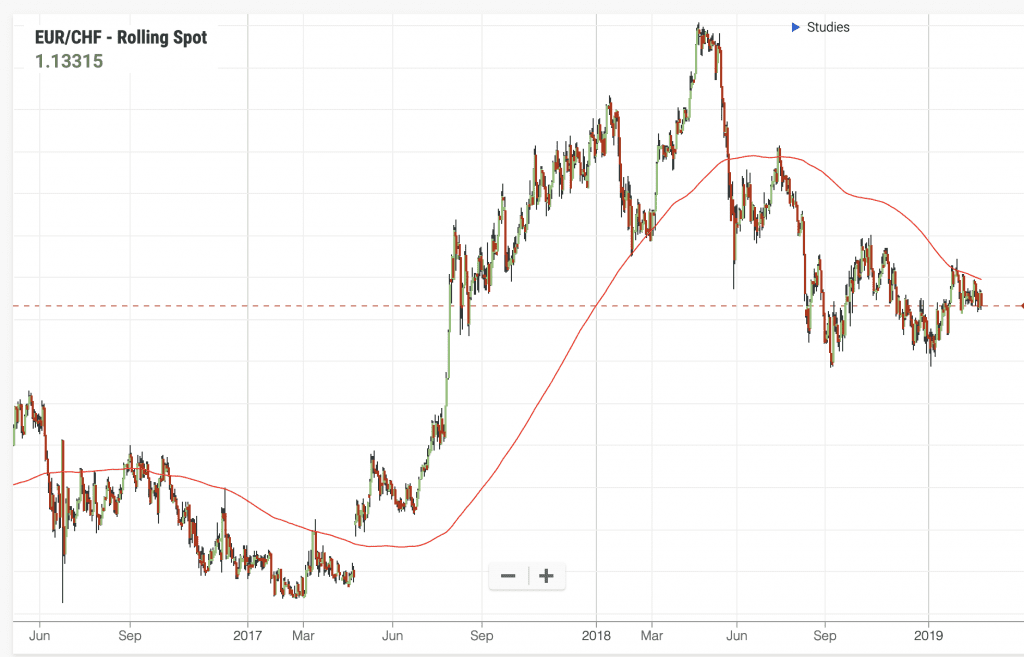
It’s the 200-period simple moving average …
This plots
the average price over the past 200 candlesticks. It’s an incredibly simple
indicator – but is a very effective measure of long-term market direction.
If the
price is above the 200SMA, we are looking at a long-term up trend.
If the
price is below the 200SMA, we are looking at a long-term down trend.
The
downside of the 200SMA is that it’s slow. It reacts to market changes at a
glacial speed, so a trend could be over for some time before the 200SMA turns,
which could leave us trading against the trend – and vulnerable.
Which is
why we need …
Steps two & three – the filter
We need to
make our trend filter more reactive, so we’re adding two more moving average
lines, which will act as a warning that the trend could be veering off course.
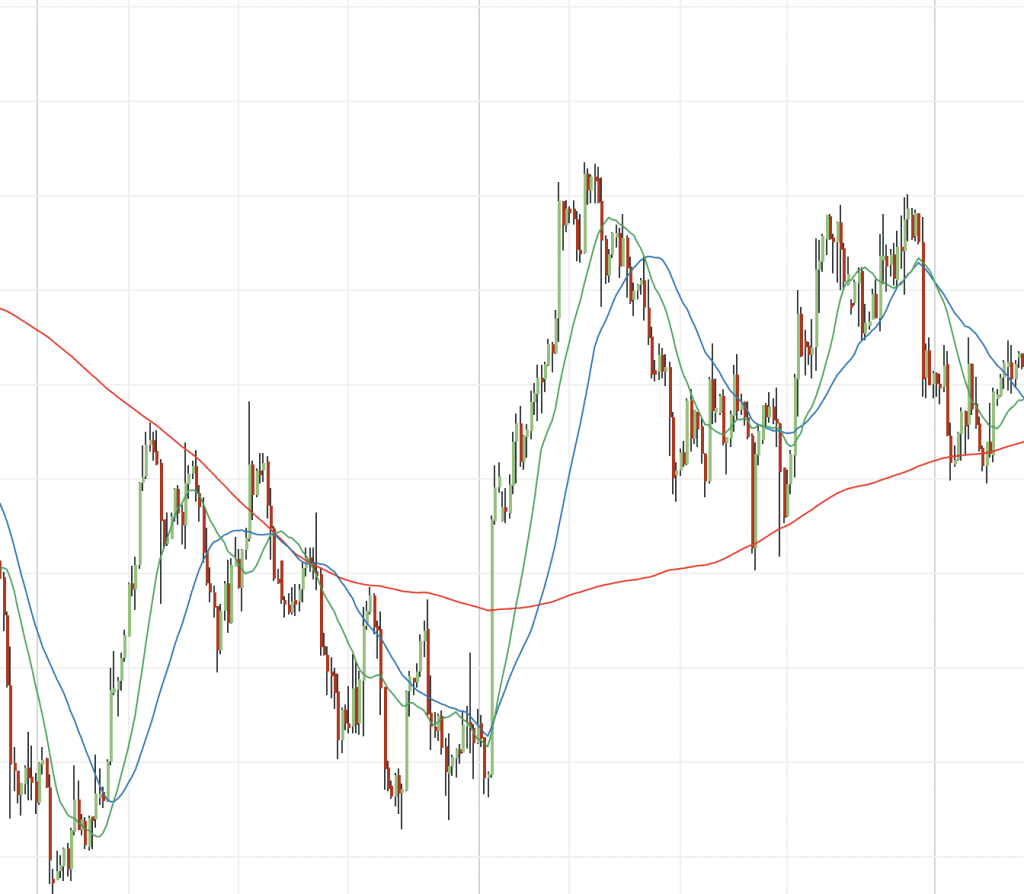
Here we have the 200SMA, with 30-period (blue) and 15-period (green) simple moving averages added …
To confirm
an up trend, the price must be above the 200 SMA, AND the 15SMA must be above
the 30SMA.
To confirm a downtrend, the price must be below the 200SMA, AND the 15SMA must be below the 30SMA.
The best indicator to identify a trend in action
On the
chart above, the red areas are where our three steps are aligned for a downtrend.
The green areas are where the three steps are aligned for an uptrend.
If the
price doesn’t conform to these rules, then the trend isn’t clear enough, and
(for a trend-following strategy) we should sit out. These are the white areas
on the chart above.
How to use the trend
It’s
important to note that this trend identifier is not an entry and exit strategy
for trades – it’s not that kind of trading tool.
This is
about looking for buy trades or sell trades within favourable conditions. We
still want to enter a trade on the back of some momentum – not just relying on
a moving average crossover.
If you want to explore some great momentum triggers, please check out this post.









2 comments
George Papazov
Thank Mark for writing this. The images that you provide helps people to understand the topic easily. I appreciate your thoughts. It’s really great.
Mark Rose
Thanks for your feedback George. I’m glad you found this useful.