October 20, 2017by Mark Rose- 5 comments
Best indicator pairs for powerful signals

How many indicators is enough? And which are the best indicator combinations to use?
Here I’ll show you two clever pairings that perfectly complement each other so they can rocket-propel your trading performance …
How many indicators do I need?
Most of those technical tools we draw on our charts are pretty one-dimensional.
They might measure price levels … how fast prices are changing … how wide recent highs and lows are …
We pop them on our charts to do a particular job, and then we complain when they fail to do a completely different job.
(We’ve probably all had bosses like that at some point!)
Which is why, unless you’re using a complex all-things-to-all-markets kind of indicator, you’re going to need a couple of them on your chart to get the job done.
The first indicator gives you the signal …
… the second indicator confirms that this is a strong enough signal to risk your money on.
But not all indicators are suited to work together.
When you’re looking for your second indicator, it needs to bringing some new information, rather than the same information, just shown in a different way.
For example, if you back up your moving average with a MACD … you may find that you’re just looking at the data. Yes, the second indicator will confirm the signal in the first, but that’s because it’s doing the exact same job.
So, here I want to show you three indicator pairings that complement each other perfectly …
Moving Average & RSI Trading Signal
Here we’ve got two very common and popular indicators combined. The moving average is all about spotting the formation of trends based on the direction that the price is moving in.
The weakness in moving averages is that they are lagging, so we want to add an indicator that’ll point to some momentum behind an ongoing move that’s been spotted. Cue RSI – a momentum indicator based on the speed of price movements.
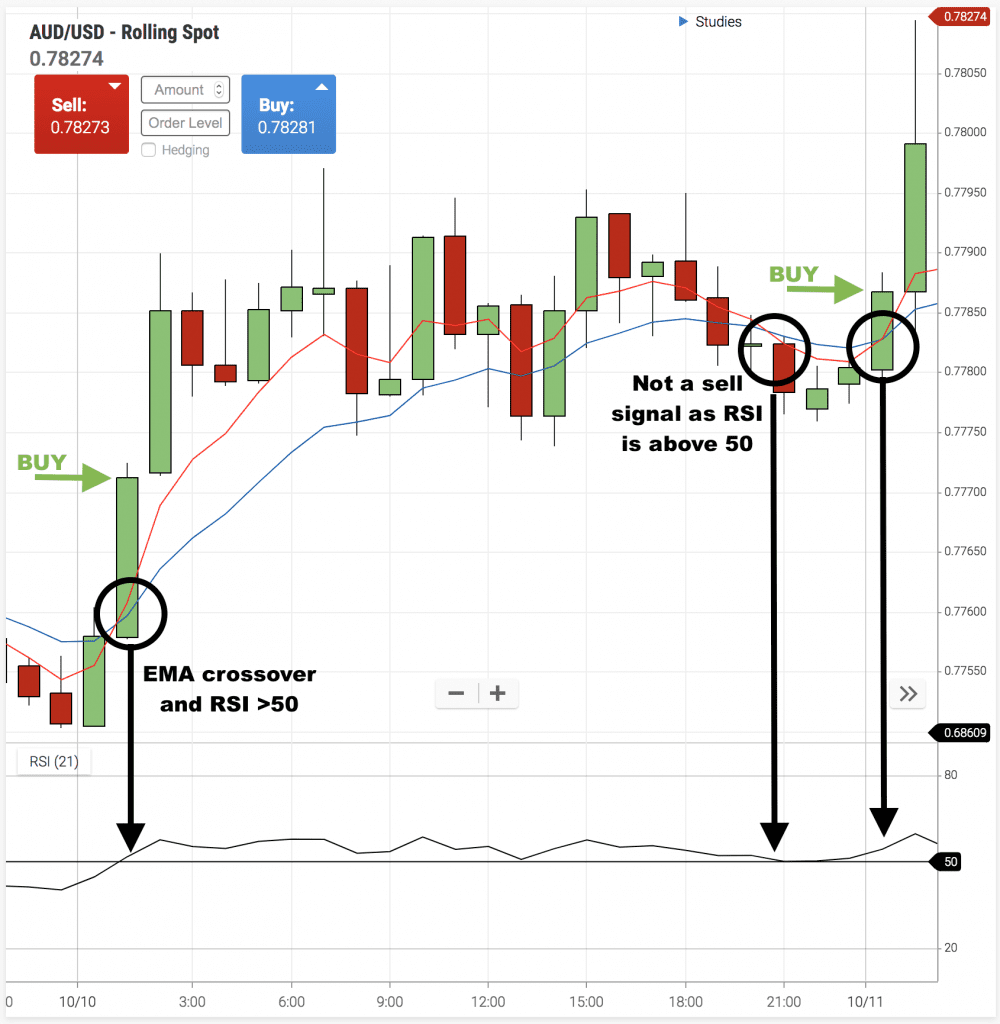
Here’s our set-up …
- 1 hour chart
- two EMAs (exponential moving averages) with settings of 5 and 12
- RSI with setting of 21
We get a BUY signal if:
- The fast EMA crosses above the slow EMA and the RSI level is above 50
We get a SELL signal if:
- The fast EMA crosses below the slow EMA and the RSI level is below 50
Here’s how it looks …
Stochastic & MACD Trading Signal
It’s easy to think, when it comes to indicators, that if they look similar, they’re giving similar information.
Which is why the oscillator MACD is over bracketed together with momentum indicators like Stochastic or RSI.
In fact, the MACD is all about moving averages, and gives information about the trend, as well as adding in data about how multiple moving averages are changing in relationship to each other.
The result is that we have an intelligent trend indicator. Add a momentum indicator, like Stochastic to that, and we have a great way to trigger a trade …
Here’s our set-up …
- 1 hour chart
- MACD with setting of 12
- Stochastic with setting of 14
We get a BUY signal if:
- The fast MACD line crosses above the slow MACD line and the fast Stochastic has crossed above the slow Stochastic within the previous 2 candles
We get a SELL signal if:
- The fast MACD line crosses below the slow MACD line and the fast Stochastic has crossed below the slow Stochastic within the previous 2 candles
Here’s how it works in practice …

At A, we have a sell trigger on the MACD, but the crossover on the Stochastic was much earlier, which tells us that this move doesn’t have enough momentum.
At B, we have a buy trigger on the MACD, and the Stochastic trigger was just two candlesticks earlier, which confirms this as a buy.
At C, we have a sell trigger on the MACD, but there’s no recent trigger on the Stochastic, so this isn’t a trade.
At D, again the MACD trigger isn’t backed up by the Stochastic (the Stochastic crossover was three candles earlier, so this doesn’t count as a trade).
And at E, we get the MACD and Stochastic crossovers almost simultaneously – confirming a sell trade.
So, we get a Buy at B, and a Sell at E, which both look like good places to be getting into a trade.
Adding a ‘Success Filter’ to your trading
What we see in both these signals is how the second indicator’s job is to filter out the weaker trades – the ones where there just isn’t momentum to carry through to a profit, or where the move has already happened.
Whatever pairings you choose for your trading signal, if your indicators agree too often, then this filter isn’t working hard enough. As traders, it’s always tempting to be in the market as much as we possibly can in order to make the best profits … but the reality is that a strong filter which ensures we trade LESS rather than MORE is going to have a much more powerful effect on your profitability.
Save
Save
Save









5 comments
Rajeev Lochan
Firstly accept my heartfelt salutation for sharing such articles and hope to be better in coming days also. We need to practice them in the live market and see the changes.
Tony
I can tell that the market is going up by the candles..not sure what the purpose is of some derivative price graph below the chart is adding information wise.
Mark Rose
Hi Tony, You make a very fair point – and there’s a lot to be said for clean charts and reading the price action. However, I feel there’s also a place for these kinds of indicators. It can be easy to lose track of overarching trends and/or momentum moves when we’re honed in on finding the best entry on a chart. Indicators also help us to be more disciplined and methodical with our trading. But, as you say – if the indicator isn’t adding anything to the picture, you’re best off without it.
Paul
The Moving Averages & RSI Trading Signal looks promising. Keeps trading simple…!
Mark Rose
Absolutely Paul – many of us are guilty of over-complicating our entry signals, when we really should be concentrating our energies on trade management.