

Best indicators – my top six technical trading tools

There are so many technical indicators – how are we supposed to pick the best ones, and to match the right ones to the task?
Here’s my top six, in terms of effectiveness and adaptability … these can give results no matter what you throw at them …
1. Moving averages
Moving averages are always a great place to start with indicators. In their simple form, they are nothing more complicated than an average of the price over the past ‘x’ number of periods, plotted onto a chart.
It smooths out the price action (the longer the period you choose, the smoother it gets), and can help us to see general direction rather than getting bogged down in all the little ups and downs.

In the daily chart above, you can see how the length of the period you choose for a moving average makes a big difference to how much ‘smoothing’ it does. The 10-day moving average smooths out the daily wobbles, while the 50-day moving average smooths even more, showing the longer term trend.
One way to use moving averages is to look for crossovers. This could be a crossover of two moving average lines, like this …

Another way is to just look at whether the price is above or below a moving average – I personally find this a good way to confirm a trend. So, if the price is above the moving average, it’s a bullish sign that I should be looking for buy trades. If it’s below the moving average, it’s a bearish sign and I should be looking for sell trades.
I think moving averages are good at showing us what technical indicators really do – they should help us to see the information we need more clearly. If they’re not making it clearer, then they’re not doing their job.
You can find out lots more about moving averages HERE
2. Bollinger bands
Indicators that do lots of different jobs for you – like checking momentum, trend, volatility – and put it all into a useful ‘buy’ or ‘sell’ signal are a great idea. However, the problem with all-singing, all-dancing technical indicators is that they can be one-trick ponies. For this list, I’ve tried to stick to simple indicators that are really adaptable and will deliver results across different trading situations.
Having said that … Bollinger bands are in my top six, and that’s partly because they do two jobs in one.
They are a measure of trend AND volatility, and are calculated from the distance the price deviates from the 20-day moving average.
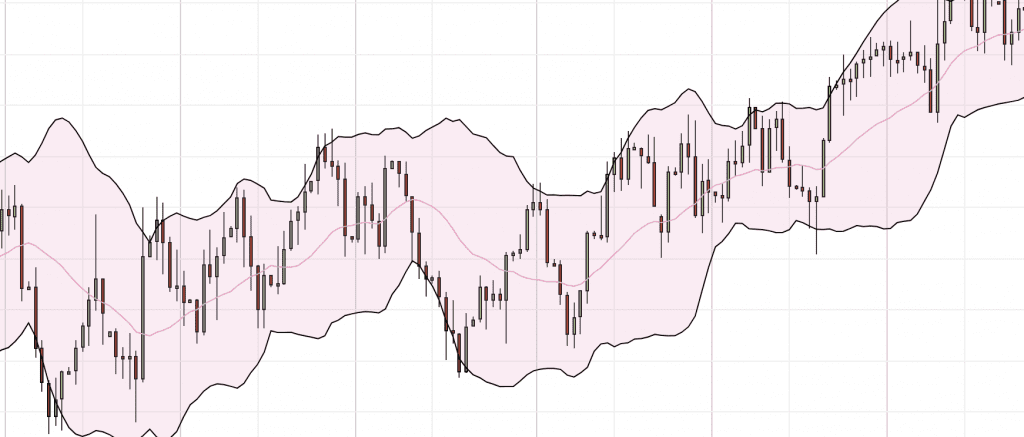
The chart above shows Bollinger bands, and we can see how much price action likes to bump along between these two bands. When it hits the edge of the bands, it’ll sometimes push through it, but often there’s strong sentiment to bring the price back towards the moving average.
The more volatile the price is, the wider the bands get. If the price range becomes tight, then the Bollinger bands close in.
Bollinger bands are great because they give us a key area (the edge of the bands) where we want to look for something to happen – either a reversal or a breakout. PLUS they give us an idea of how far prices are likely to run.
You can find out lots more about Bollinger bands HERE
3. Stochastic Oscillator
The Stochastic is a oscillator indicator, which means that it swings up and down between set levels. It’s used to measure the momentum of price action, and is generally considered to be a good tool timing your entry into and exit from the market.
When the price is in a trend, it can be tricky to judge when to get into that market – if we enter on a pullback, we can still lose money, even if the trend continues.
This is where a momentum indicator like Stochastics can help …

This tells us that NOW is the good moment to buy into this trend. And here’s what happens …

By watching the ebb and flow of momentum during a trend, you can better judge your entries and exits.
4. RSI
The RSI is another momentum indicator. It looks a lot like Stochastics, and is often used in the same way. However, the data behind the RSI is very different.
While the Stochastic indicator is based on closing prices (and works on the assumption that price will move closer to it’s highs in an uptrend, and closer to lows in a downtrend), the RSI measures the speed of price movements.
Here’s RSI at work in a clear trading channel … When the price butts up against resistance and we have an overbought signal, then we have an opportunity to profit from a sell trade. When the price meets resistance at the bottom of the channel, combined with an oversold signal, then we have a buying opportunity.

5. MACD
Moving averages are great and useful things when they’re charging along in a clear direction and the trend is there for us to see. But a lot of the time they meander along, and it’s hard to see if the trend is running out, gearing up, or just reversing.
What we need is a tool that’ll measure the strength of the trend.
Cue – the MACD indicator.
The MACD measures the rate that the moving average is changing – telling us just how powerful a move is.
It takes the form of a signal line, a smoothed out version of that signal line, and a histogram which measures how close the two lines are to each other.
The simplest way to use the MACD is to look for when these two lines cross each other …

6. ATR
The Average True Range is one of the simplest, but most useful indicators a trader can use.
It does nothing fancier than telling us the average trading range over ‘x’ number of periods. The standard setting is 14, so this will tell us the average move the market made over the past 14 days (or whatever timeframe you’re looking at).

So often I see traders who are looking for market moves that are too big for the timescale they’re trading in. They might be wanting to get 100 pips profit on a short-term trade from a market that hasn’t moved more than 50 pips a day for the past two weeks.
If we know how much the market has been moving recently, we can make an informed judgement on where to take profits (and cut losses).
Putting it all together
As I said at the beginning of this post, I don’t claim that any of these indicators have magical powers or can be infallible in the markets. And I wouldn’t recommend relying on any one indicator. Getting a good signal is about combining two or three indicators – where each can make up for weaknesses in the others.
The indicators listed here come under the categories: trend, momentum and volatility. It’s good to mix these up, so I’d recommend taking one indicator from each category to make a perfect combination.
You can find more information about how indicators work together HERE
To enjoy more content and get it faster Follow @TradersBulletin


JOIN US ...
Get full access to members-only resources, plus my weekly email updates ...
I will NEVER share your details for marketing purposes. Privacy policy
Strategies I'm Using
 It has taken 2 years to persuade this market…
- These videos show how to make 24% gains in…
 As you can see from all the data I've…
 Get the low down on the Heikin Ashi Mountain…





2 comments
Mark Rose
Hi George, Thanks for your comments. The images shown here are for the default settings, but if you’re interested in fiddling with your MACD and Stochastics, you might like these two trading ideas:
https://tradersbulletin.co.uk/indicator-hack-double-macd/
https://tradersbulletin.co.uk/hack-your-stochastic-indicator/
Let me know what you think, Mark
George Howarth
An interesting compilation – thanks. What settings are you using for e.g. Stochastics or MACD? I’ve found the default settings don’t always work best for me, but it would be interesting to know what you’ve found and what works best for you.