March 8, 2019by Mark Rose- 1 comment
What’s the best moving average?
Moving averages are probably the best-know and one of the most widely used trading indicators.
But they come in a lot of shapes and sizes, which makes them tricky to pigeon-hole.
Here we’ll look at finding the best tool for the job …
First off, there’s the number of periods in your moving average – it’s crucial to match this to the type of trading you’re doing.
Secondly, there are types of moving average: simple, exponential, triangular … and lots more. Each have a subtly different calculation behind them, and can look quite different on a chart.
I’ll look at each in turn, but first let’s recap on what a moving average is …
Simple moving averages
A simple moving average is the average price over a given number of candlesticks.
Let’s say that we’re looking at a 5-period simple moving average … we’ll simply add up the prices for the last 5 periods, and divides the sum by 5 to get an answer.
When we apply this to a chart, it’ll look something like this …

Here we have a 5-day simple moving average, giving a ‘smoothed’ out line of price behaviour on our chart.
Loosely speaking, if the price is below the moving average, it’s a bearish sign that prices are moving downwards. Likewise, if the price is above the moving average, it’s a bullish sign that prices are going up.
A moving average is what’s called a ‘lagging indicator’ which means that it is simply showing us what’s happened and doesn’t claim to have any predictive powers. However, as prices like to form trends – they are a very useful tools for monitoring when trends establish, and we can piggy-back profits off the back of them.
How many periods should you set?
The example above shows a 5-period moving average. This is a relatively low number of periods to use, which makes it a ‘fast’ moving average – i.e. it reacts to price changes quickly, and prices can flit from one side to the other.
Compare this to a 200-period moving average, also on a daily chart …
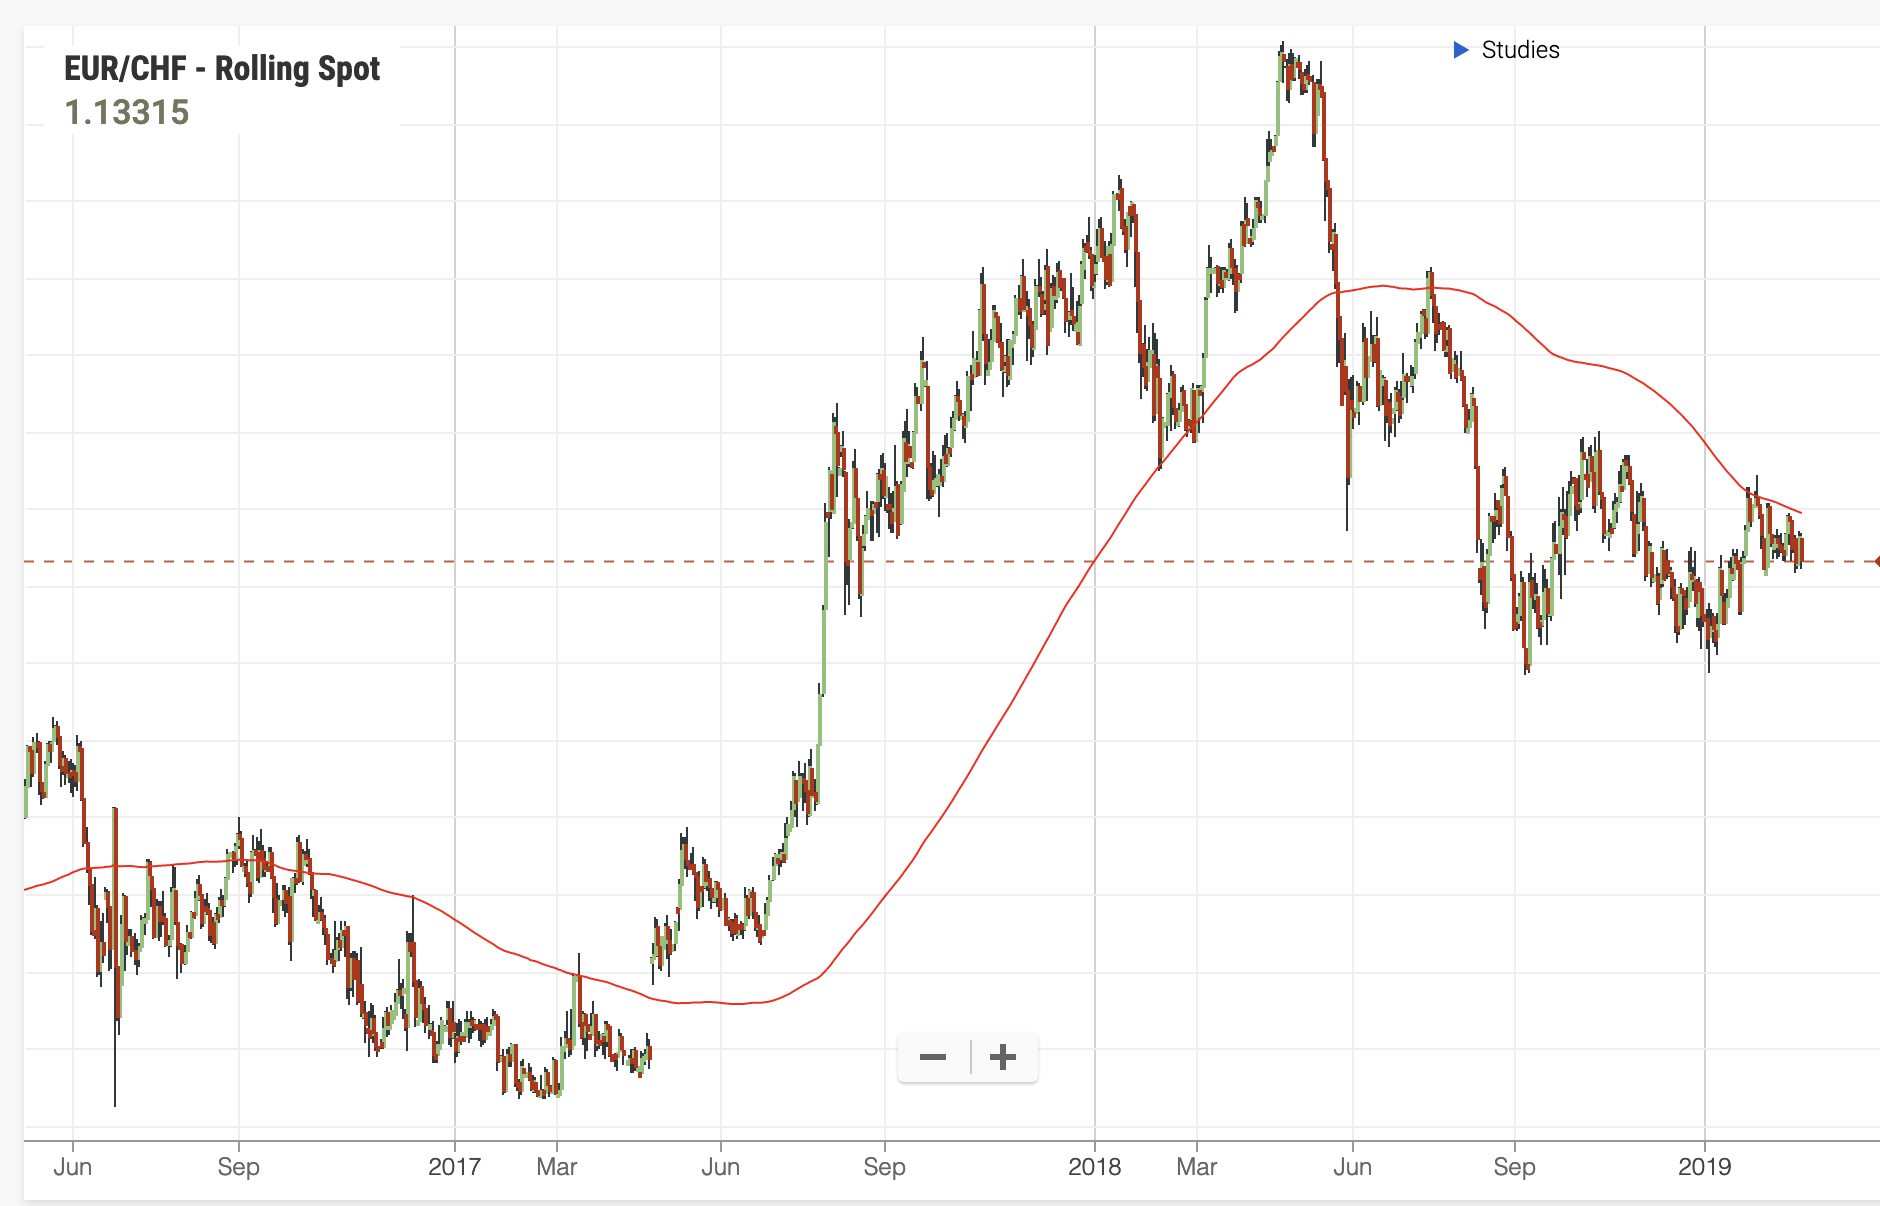
With a 200-SMA, the price rarely flits from one side to the other – and when it does make a significant move through the moving average, it tends to indicate a long-term change of direction.
Both these examples show how wildly different moving averages can be – yet both types can be powerful tools for traders.
Note how prices trace these levels. The long-term price can be seen to bounce off the 200SMA several times before it gains the power to move through it.
So, which are the right settings for you?
When judging which is the right number of periods for you, one of the most important questions to ask yourself is: how long into the future is my trade likely to run?
If the answer is that you’re looking to follow a market trend over the next 3–12 months (i.e. 90–365 daily candles), then a 200-day moving average could be a useful tool. But if you’re looking to take profits in the next day or two, then a 200-day moving average is useless (unless you happen to be very close to the 200-ma and the price is potentially about to bounce off it).
If you’re using a moving average to judge price direction over the next few candlesticks, then a shorter period of 3–10 periods would be suitable.
Using longer periods as trade-filters
Sometimes you might be using a moving-average crossover as a trade trigger – i.e. looking to buy when the price moves above the moving average, or looking to sell when it crosses below the moving average, as in the example below, of a 50-period SMA on a 15-minute chart …
However, one of the most popular and powerful ways to use a moving average is as a filter.
This adds the moving averages to an already-established trading signal, but will only take buy trades if the price is above the moving average, and will only take sell trades if the price is below the moving average.
This kind of filtering system will rely on a longer term moving average that you might use if you wanted your MA to ‘trigger’ the trade itself.
Here’s an example of how that can work.
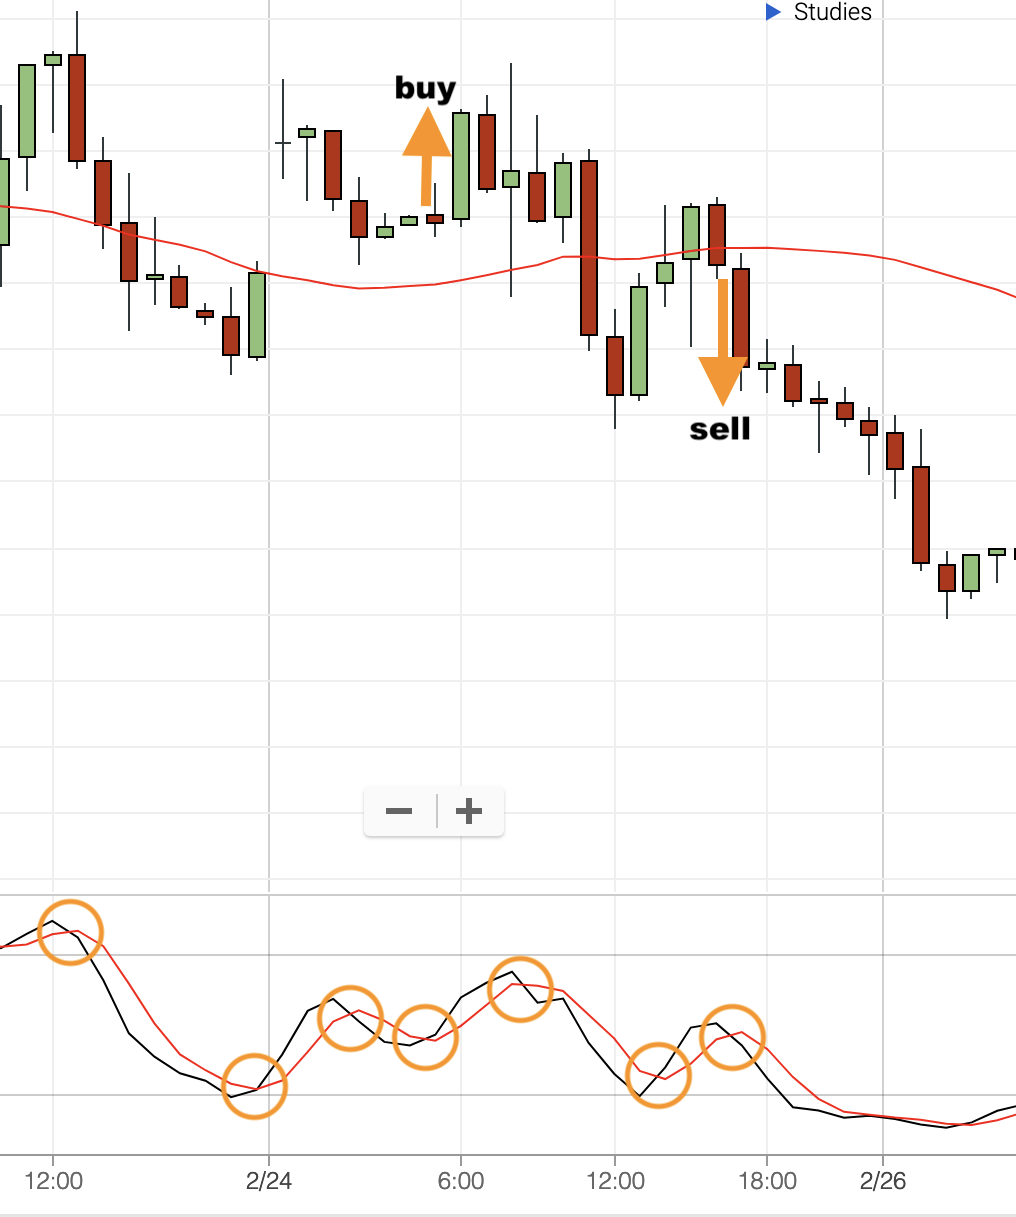
In the chart above, we’re taking a Stochastic crossover as a trade trigger, buying if the fast moves above the slower line, and selling if the fast moves below the slower line. (I.e. we buy if the black crosses above the red; we sell if the black crosses below the red.) But we’ve added a slow-moving average filter here, in the form of 40-period sma, and we’ll only take buy signals if the price is above the moving average, and we’ll only take sell signals if the price is below the moving average.
So, what about the different types of moving average?
There are a huge number of variations on the simple moving average, and each promises to give more and more accurate readings, with fewer false signals.
Which is the right one for you?
There are two key things that these variations tend to give us: extra smoothing and added weight.
‘Smoothing’ means that our moving average is less jittery – this is useful if you’re using a shorter number of periods and you’re worried about it being pulled out of line by occasional price spikes.
The chart below shows the simple moving average (in red) and the triangular moving average (in purple).
The triangular moving average is a moving average of the simple moving average values. It’s calculated as:
TMA = (SUM of SMA values) / (number of periods)
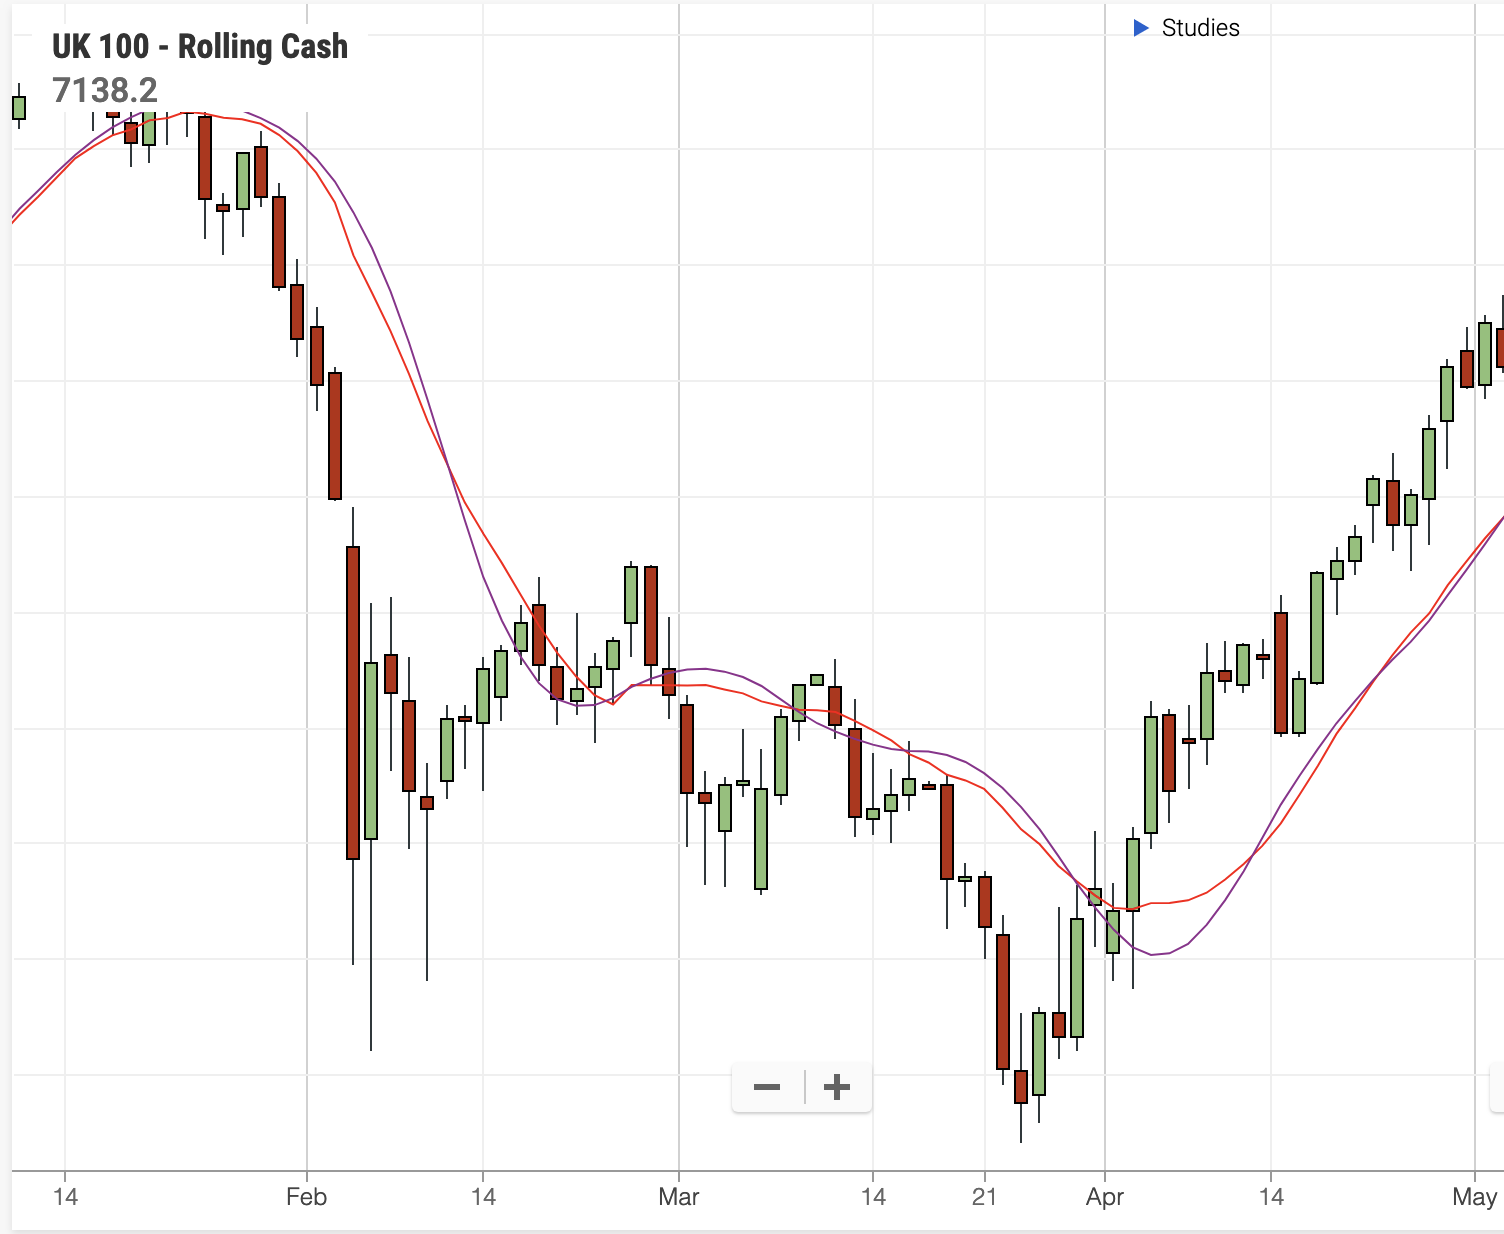
As you can see, the result is a smoothed out moving average line.
Another category of ‘special’ moving averages are those that give more significance to the most recent prices. These include Exponential moving averages and weighted moving averages – both of these give an extra ‘weight’ to recent data.
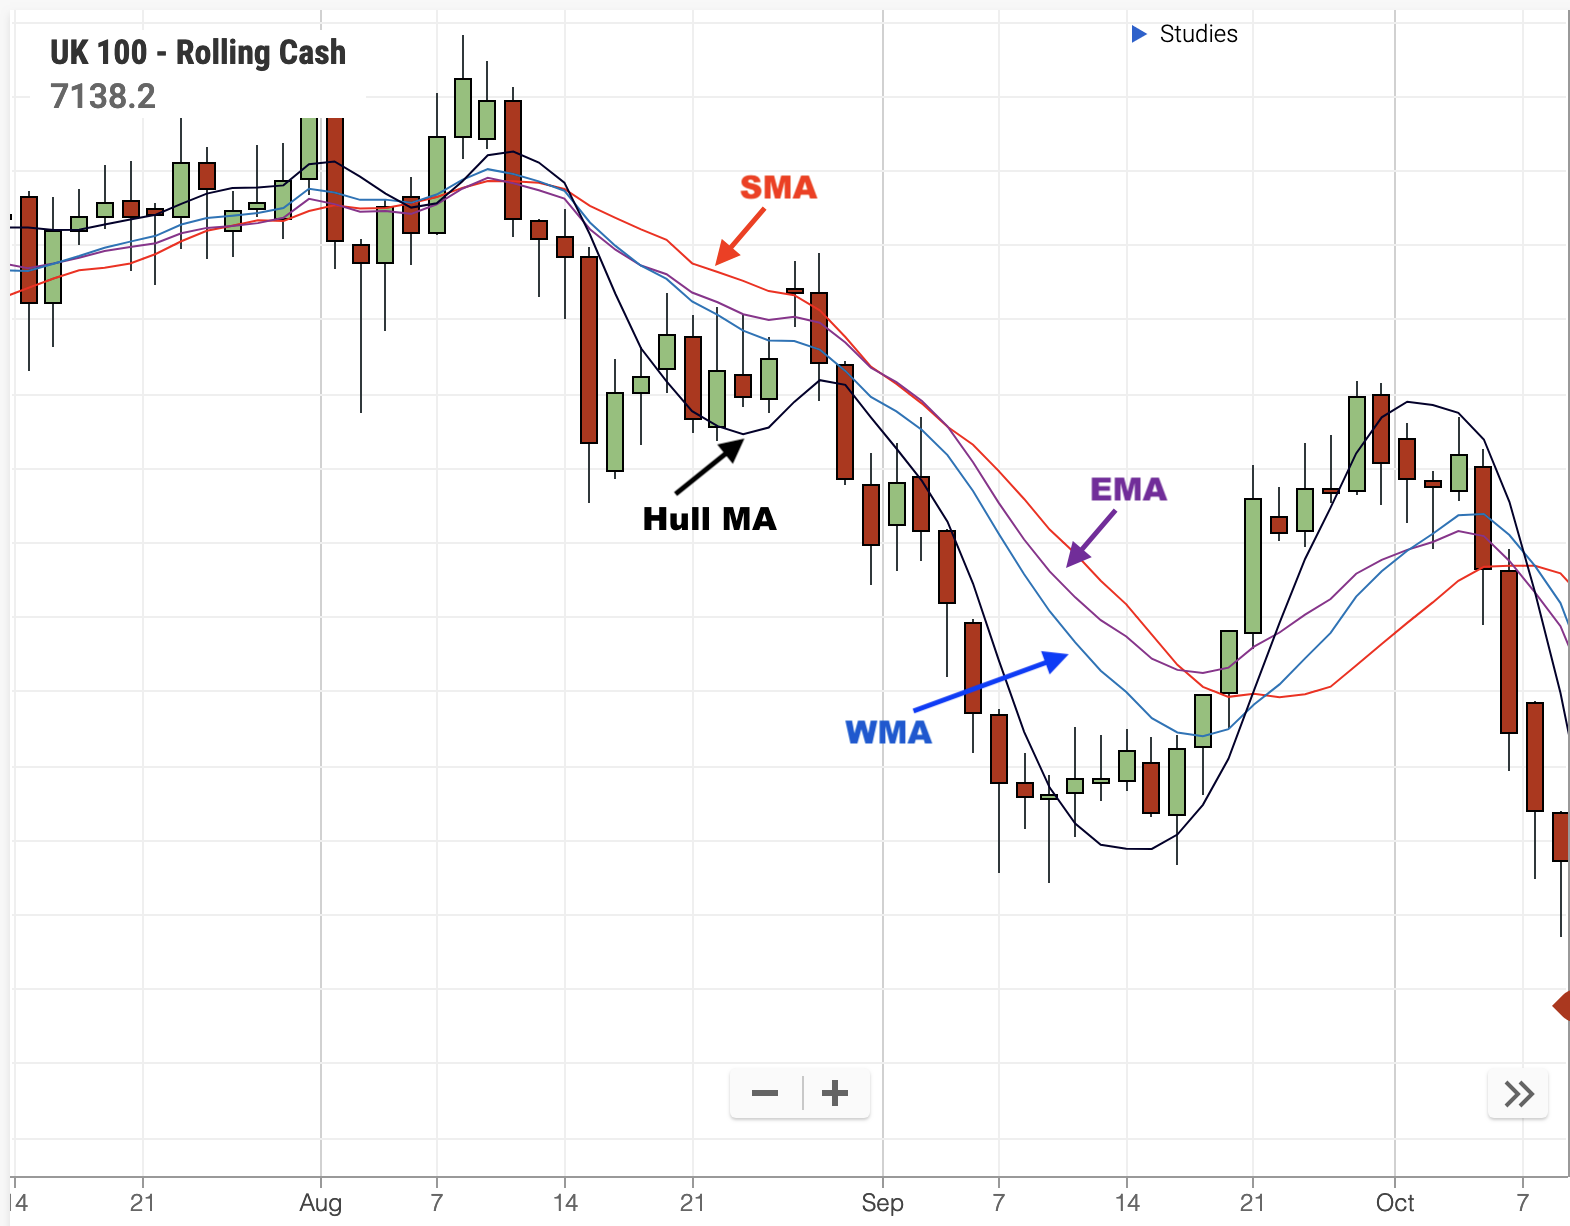
Here’s how they look on a chart (simple moving average in red; weighted moving average in blue; exponential moving average in purple)…
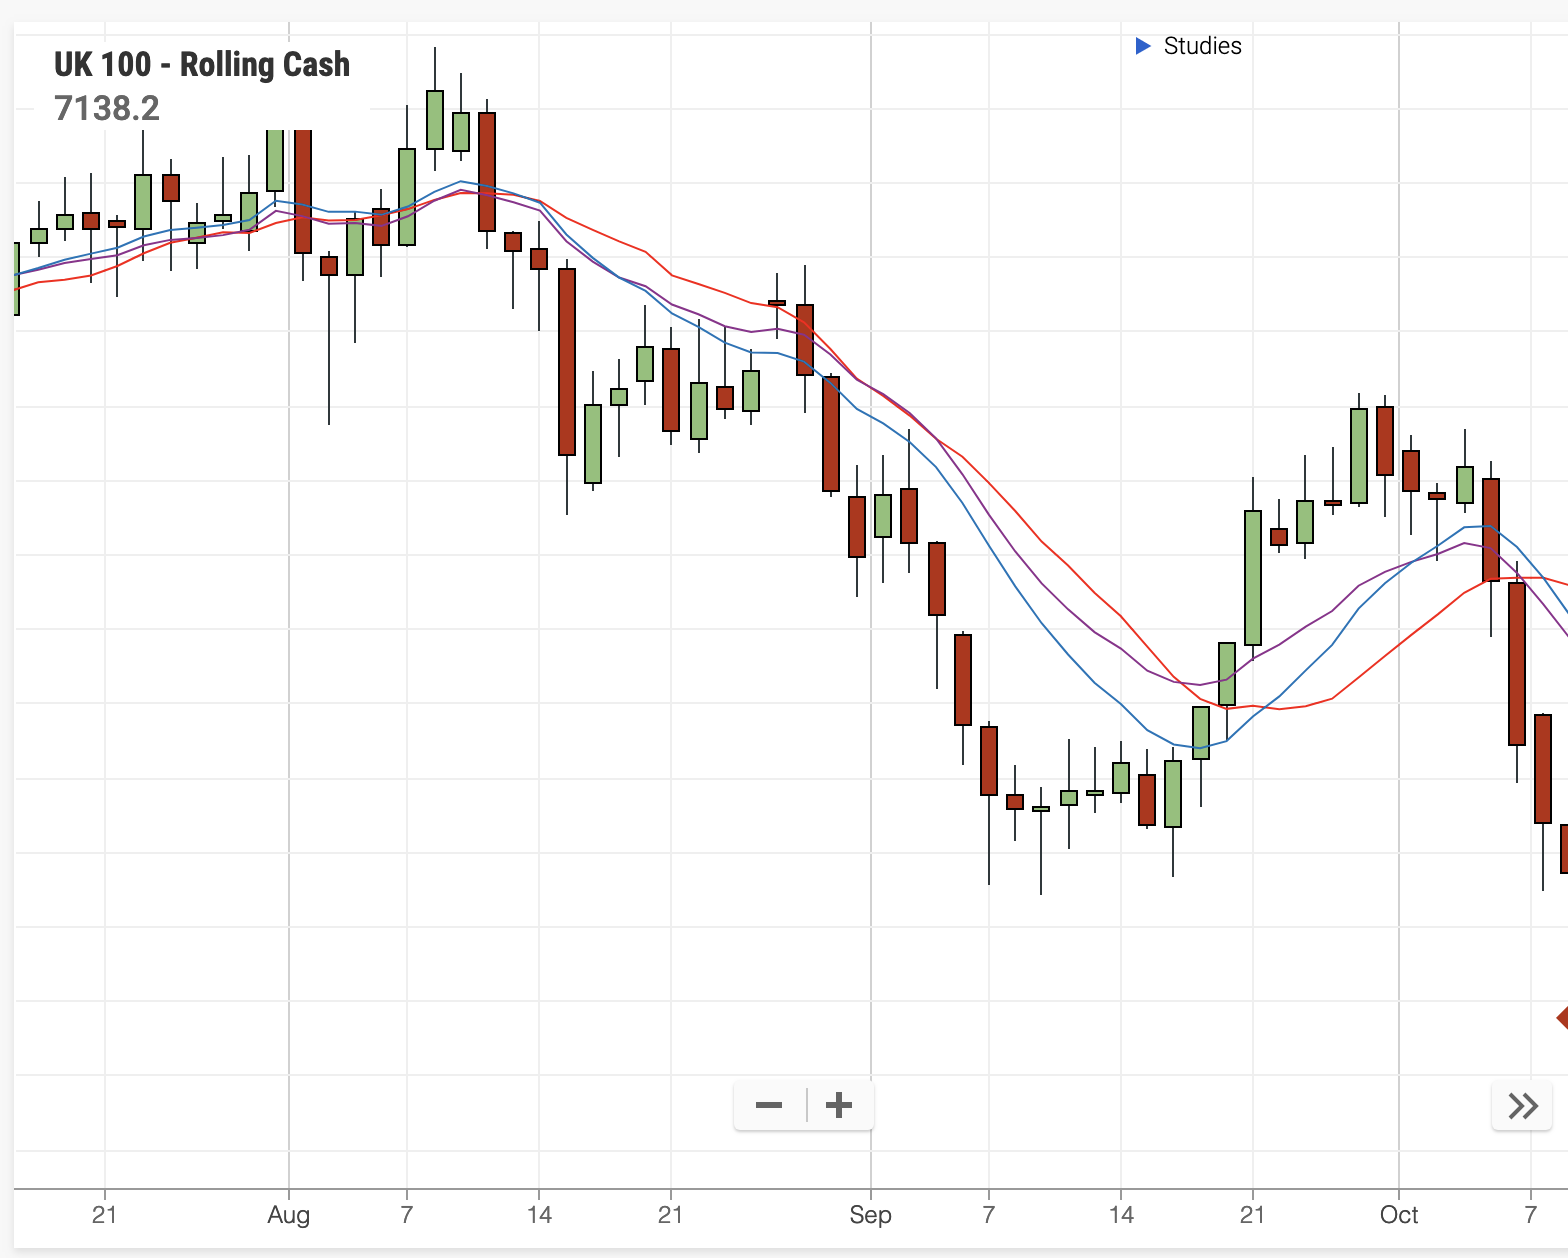
You’ll notice that the EMA reacts most quickly to price changes, because its ‘weighting’ is more significant than the WMA; with the simple moving average lagging behind both of them.
If you like the idea of getting the ‘weighting’ factor and the ‘smoothing’ factor in just one moving average, there’s the ‘Hull moving average’ …
If you’re head is spinning with emas, smas, wmas, hmas … please don’t worry. My advice is not to sweat the type of moving average too much. If your moving average is too jumpy – consider using a longer period, or adding some smoothing. If you want faster reactions from your moving average – consider using shorter periods, or using a weighted moving average. There’ll always be an element of playing around to find what suits you best.
But I’m not going to leave it there. I want to throw in one final moving part in your moving average …
What the heck is the OHLC variable?
Some charting software will give you the option to decide if you want to base your moving average calculations on the open, high, low or close of the candlestick periods.
In most cases, because we’re talking about averages, this just isn’t that important, as long as you’re being consistent.
But there are a few instances where you may find this little tweak makes all the difference …
In the example below, we’re using an exponential moving average to tell us when this trend has run its course – if the candle breaches the moving average, we’ll exit our buy trade. The purple line is a normal EMA, the pink line is an EMA based on the low price of each candle …
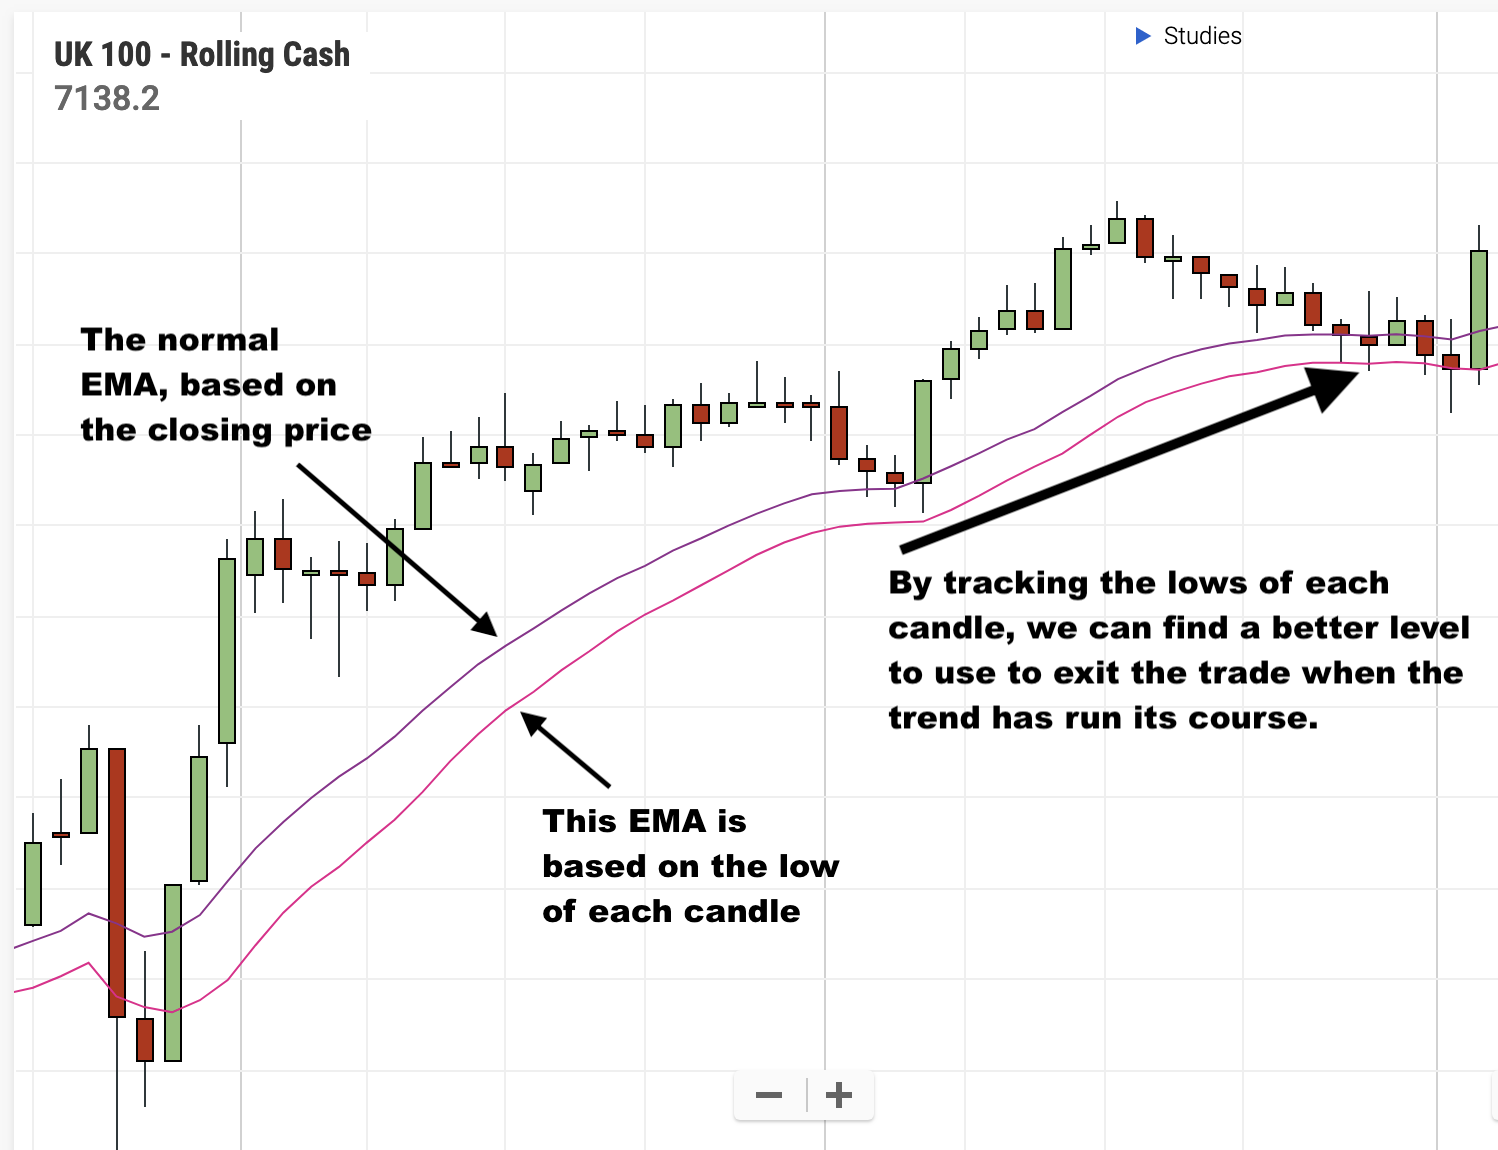
In an uptrend like this, there’s a good argument for using the lows to draw our moving average. Likewise, in a downtrend, we could choose to use the highs of the candles if we’re looking for a breach to the up-side.
Putting it together
I appreciate this is a load of information, but it’s worth remembering that moving averages are one of the simplest indicators out there, and one of the most widely used.
Many other more advanced indicators are based on moving average data, so even if you don’t think you’re using moving averages – there’s a good chance they are hidden inside the calculations of your indicators.
They are incredibly useful for finding overarching trends … for spotting the breakdown of a trend … for finding support or resistance levels in a trend …
My recommendation for applying them is to have a play around with some different settings, but then to stick with a single setting for a while. Remember – there is no perfect indicator, but the more familiar you become with an indicator, the better you’ll be at spotting its weaknesses.
Yes, these are lagging indicators, which can make them slow to react, but it also means they are more dependable.
To enjoy more content and get it faster








1 comment
MikeSB
Great explanation Mark, as ever. I feel like I’m an expert on moving averages now!