April 10, 2015by Mark Rose- 5 comments
Indicator hack #1: pimp your Stochastic indicator

Most of the time, my advice is to not fiddle with the settings on your technical indicators.
There’s normally a default setting, and that’s there because decades of traders have found those to be useful settings. As with many technical tools – we use them to know what the ‘crowd’ are thinking, so it’s helpful to have the same picture as ‘the crowd’
Constantly chopping and changing doesn’t help.
However, this week I’d like to look at a minute hack you can make to the Stochastic indicator that will ensure it’s working to YOUR timeframe, rather than anyone else’s. Plus, this hack can get you into trades faster – ahead of that crowd!
#1 Hack: pick pullbacks with the Stochastic indicator
The stochastic indicator, like most oscillators, is notoriously unreliable in a strongly trending market.
These indicators can sit in the ‘overbought’ or ‘oversold’ territory for long periods, while the market carries on in the direction it wants to move in, giving us repeated false signals.

As this chart shows, this is not how we should be using the Stochastic indicator – it’s just too unreliable.
So, do we put this indicator to one side, until we have better market conditions?
That’s one option, but what I’d like to show you here is a way to hone your Stochastic indicator to get you into fast pullback trades within the trend.
So, we’re not trading overbought/oversold conditions. Instead, we’re comparing price pullbacks within our trend, to ensure we pick up profits from the retracement (but avoid getting stung by market reversals).
Sounds great – but what does that mean in practice?

In the image above, we’d enter a sell trade to take advantage of the swing down after the upward retracement.
And our hacked Stochastic indicator is going to show us how to time these trades to perfection …
The hack
The first thing is to ‘hack’ our indicator.
This means deviating from the standard Stochastics settings of 14,3,3
Instead, we want to use the settings 5,3,3
This is not recommended if you’re using Stochastics for measuring tops and bottoms – but for our pullback trick, it will help us with our short-term timing.
Now, we find a trending market and apply our newly hacked indicator to it …
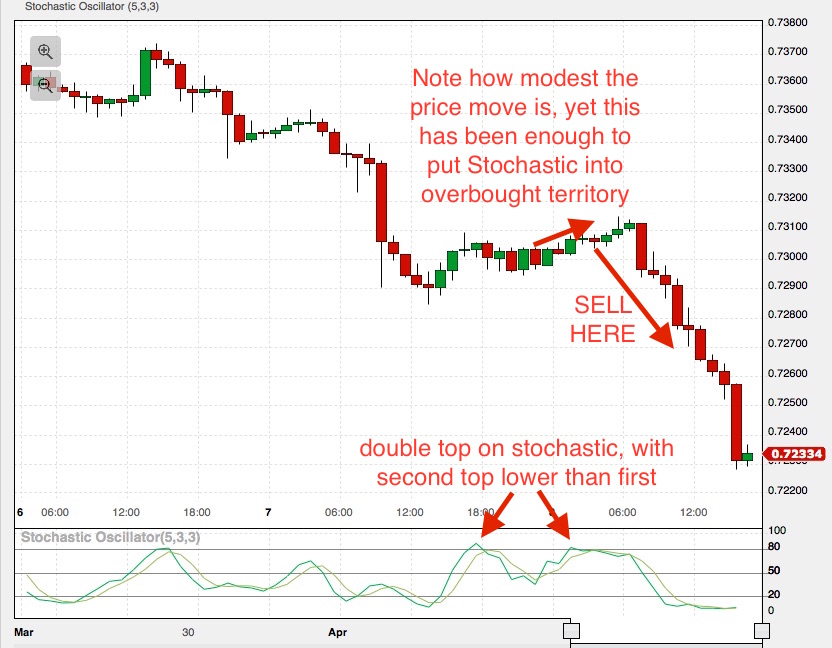
We’re looking for the Stochastic indicator to make a double top, both above 80 (in a down trend); or a double bottom, both below 20 (in an up trend).
We also want the second top or bottom to be smaller than the first.
In the example above, the second top into overbought territory is accompanies by a very slight upswing in the price. This warns us that the price is poised to swing downwards.
We’ll enter our trade when the fast stochastic crosses under the slow one. The price continues to drift upwards for three candles, then accelerates downwards.
Here’s another example, this time in an uptrend …
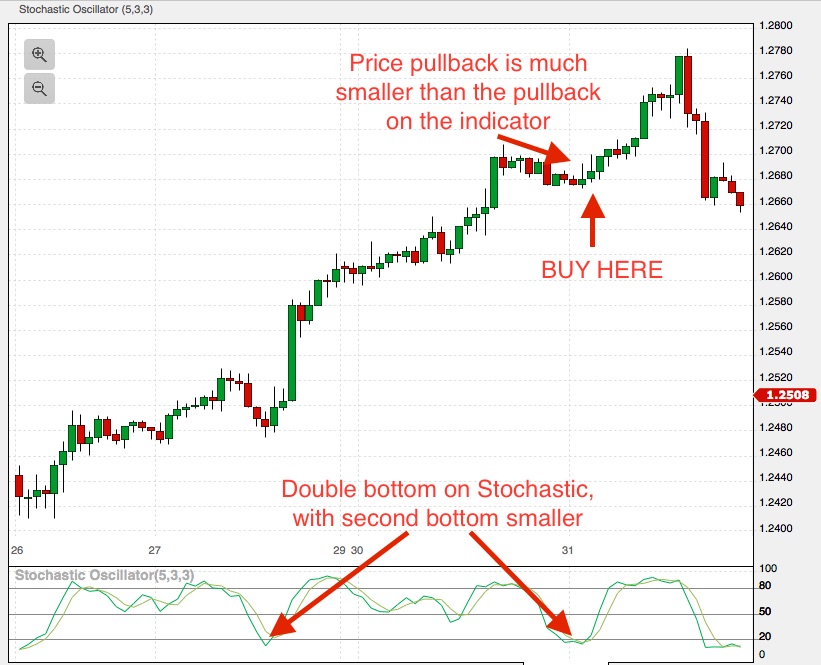
Remember to look for the stochastic dropping below 20, but the market barely drops – these are the perfect conditions for our Stochastic indicator hack to work.
Remember, this hack is to match your indicator for a particular purpose. If you’re using Stochastics to measure overbought and oversold conditions, these settings are much too volatile, and will give you a lot of ‘noise’ and false signals.
I’d reiterate my point that I don’t recommend fiddling with indicator settings too often – any setting you choose will have weaknesses, and by sticking with one setting, you’ll come to recognize those weaknesses – where it gets you in too late, or where it might give false signals.
The Stochastic is a powerful trading tool – one of the more sophisticated indicators, which looks at the latest closing price and compares that to past price ranges. It’s an indicator that’s well worth getting to know …
To enjoy more content and get it faster










5 comments
Charles
Mark – Could you advise n these current settings, which should be changed?
%K periods = 13
%K smoothing periods = 25
%K double smoothing periods = 2
%D Periods = 9
Thanks
Mark Rose
Hi Charles, looks like you are using a double smoothing stochastic – do you have the option on your software for the bog-standard Stochastic oscillator?
Paul
Neat method. I like the confirmation from the divergence. A nice candlestick reversal signal can also be helpful.
sammy.
Hi. Mark.
Can the hack be used in any time frame.
Regards Sammy.
Mark Rose
Hi Sammy, I’d recommend a 1hr timeframe or shorter. Otherwise I think the indicator would become too jumpy for longer term trading.