

My 5 best trend indicators

I’ve talked a lot recently about how important trend trading is to medium- and long-term investment.
In fact, any kind of trading will be improved if you have an overview of which way the price is trending. Even if you’re trading short-term ranges, your results will still be improved if you take more aggressive positions in the direction of the trend.
So, how do we know which way a price is trending?
Here’s my pick of the best ways to spot a trend …
1. Moving averages
No discussion of trend indicators would be complete without moving averages!
A simple moving average is created by adding up the closing prices of “x” number of periods, and then dividing them by “x”. So, a 200-period MA is the average closing price over 200 periods (candlesticks); the 50-period MA is the average closing price over 50 periods … and so on.
The lines these figures plot onto a chart will show us trends, with the daily “noise” of price wobbles taken out. A 20-period MA will show the short-term trend; the 50-period MA will show the medium-term trend; and the 200-period MA will show the long-term market trend.
Because moving averages are created by looking at past data, they are what are called “lagging indicators” – i.e. they tell us about what has happened, rather than about what is going to happen. But that doesn’t mean that they can’t help us to make a judgment on what the price might do.
When a price is in an uptrend, it is most likely to be sitting above the moving average line. When it’s in a downtrend, it’ll be below the moving average.
Therefore, when a price crosses a moving average line – it suggests that a trend change has occurred. This is called a moving average crossover, and is one of the most basic technical signals a trader can use.

Traders will often use more than one moving average line for a more powerful crossover signal.
Here we have a 10SMA and a 50SMA on a chart, and we’re looking for the two moving average lines to cross each other. If the 10SMA moves above the 50SMA, it’s a confirmation of an up trend. If the 10SMA moves below the 50SMA, it’s a confirmation of a down trend.

2. MACD
The MACD indicator is a moving average with bells on. Or, more accurately, it’s a moving average of a moving average …
It takes the form of two lines and a histogram chart, like this …

The black line on the chart above is MACD trigger line; the red line is a smoothed out (moving average) of the black line; and the histogram plots how these two lines are moving closer together and further apart.
If our fast MACD line (black) crosses below the slow one (red), this is a signal for a downtrend. If the fast line crosses above the slow one, this is a signal for an uptrend.
The size of the histogram bars are a great tool on the MACD – if they’re getting bigger, then the trend is gathering pace, but if they are getting smaller, it’s a sign that the trend may be losing momentum.
3. Parabolic Stop and Reversal System
Commonly called PSAR, this indicator looks a little different to the lines and oscillators we’re used to. It takes the form of a series of dots or dashes, either below the price (indicating an up trend), or above the price (indicating a down trend).
It looks something like this …
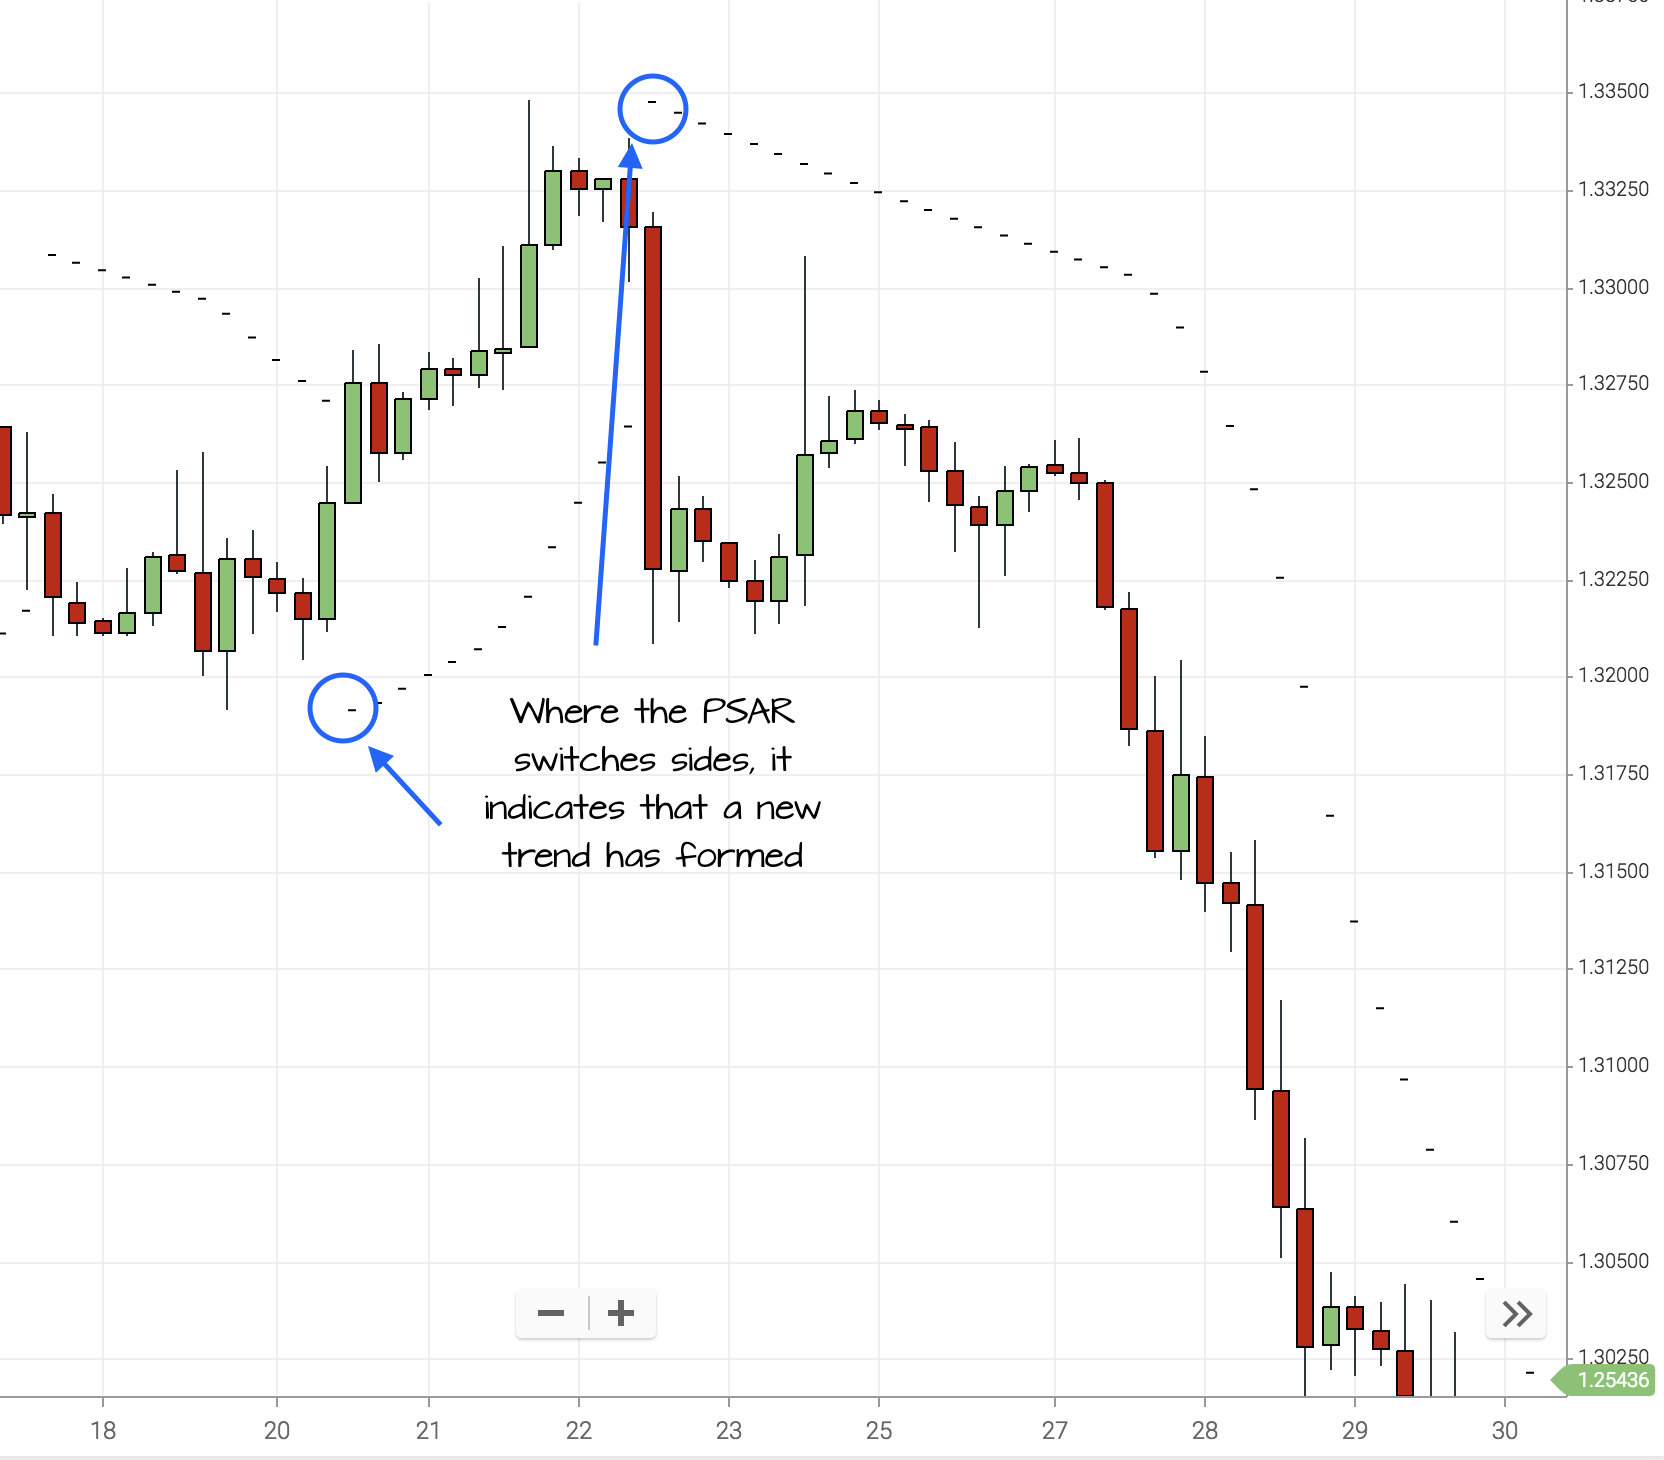
But one of the key things trend traders use the PSAR for is for the placement of trailing stops – the dots that follow price trends are a great guide for where to position your stops in order to lock in profits.
4. Linear Regression
Most of the indicators on this page are related to moving averages, or moving averages of moving averages …
Linear regression, however, does things a little differently. And – arguably – it gives a better picture than a mathematical ‘average’.
Moving averages are about adding up previous price levels, calculating their average, and then plotting that onto a chart.
Instead of working out averages, a linear regression line is about drawing a ‘best fit’ onto our chart.
Something like this …

And then this series of lines is plotted, to give us something that looks suspiciously like a moving average …

There’s a little family of linear regression tools you can use … with the linear regression slope, and the R-squared linear regression indictor.
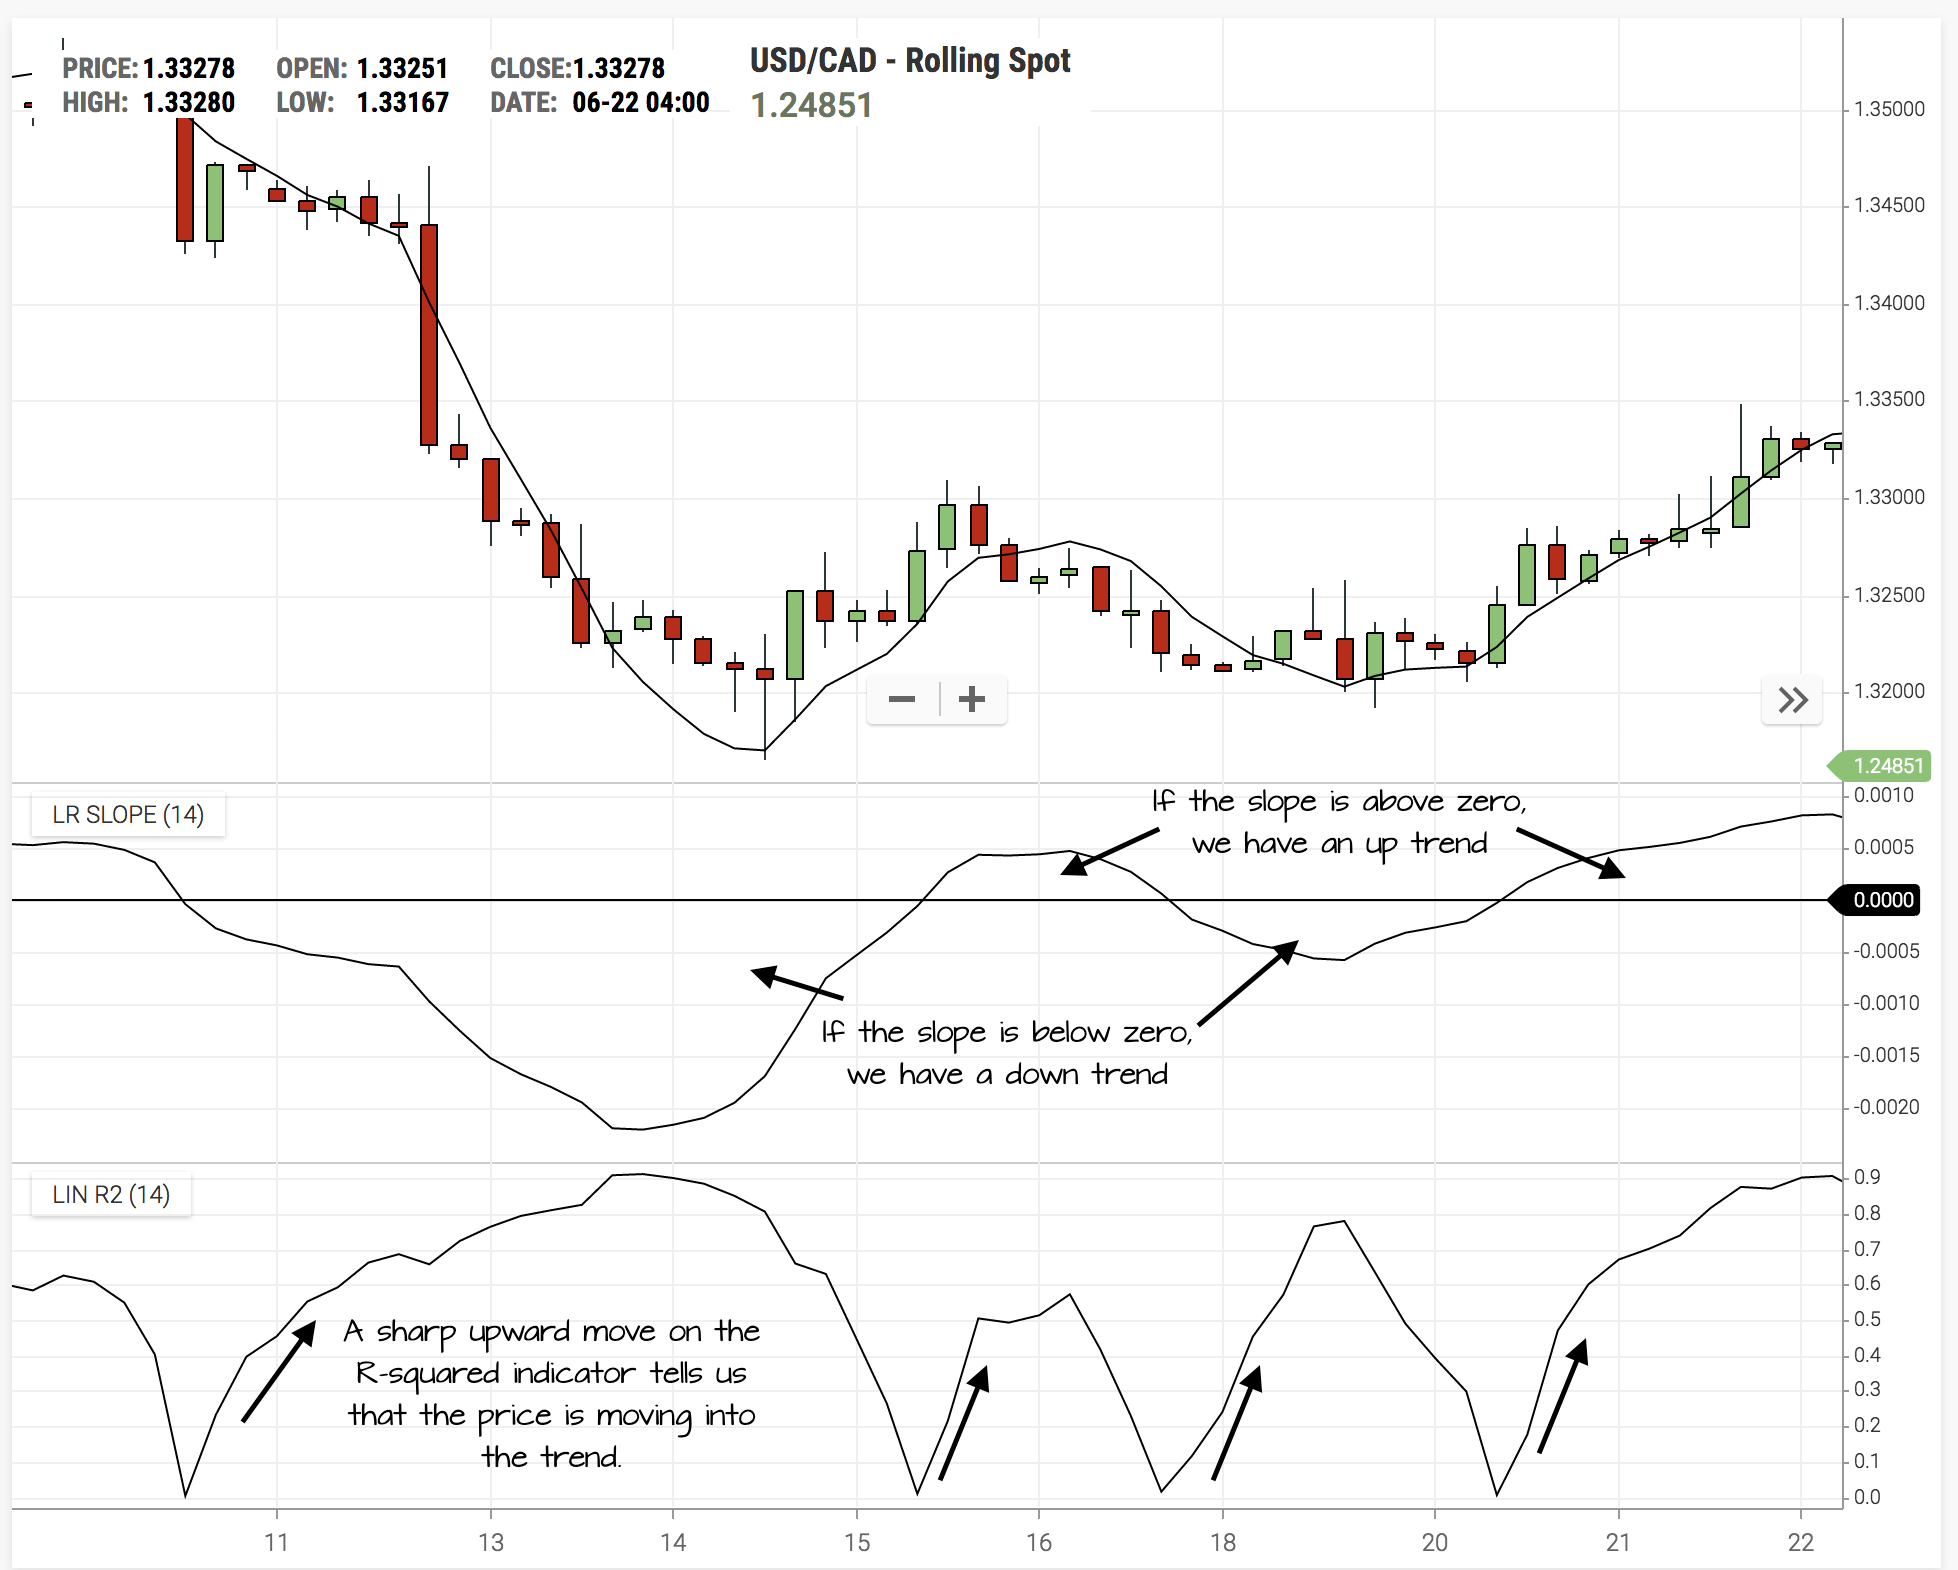
If the linear regression slope is above zero, then the trend is up; if it’s below zero, the trend is down.
The R-squared indicator is interesting … where this accelerates upwards, we have the price moving sharply in the direction of the trend. As a trend-following, it’s useful to watch for this line starting to level off – a sign that the trend is easing off and it could be time to get out of our trade.
5. Directional movement indicator & ADX
Based on moving averages, this indicator not only tells us which direction the trend is going … it also tells us the strength of that trend.
One of the big problems with any trend-following strategy is knowing when the trend just isn’t strong enough to trade. Most trend traders have been stung with losses when the market loses direction, or whipsaws around – so, this extra information means we can ignore signals when the trend isn’t strong enough.
The Directional Movement Indicator looks like this …

The green cloud indicates an upward price trend, while the red cloud indicates a downward trend. We add to this the ADX line – that’s the black line on the chart above. If the ADX is above 20, then the trend is sufficiently strong. Below 20, and it’s too weak.
Combining indicators for success
Remember that the trend indicators here are loosely based on similar information (although the linear regression lines are drawn slightly differently). For that reason, if you’re looking for a ‘portfolio’ of successful indicators, it would be wise not to double-up on similar information.
The whole point of combining indicators is that we gather information from more than one source, compare it … and if those sources agree with each other, we’ll act on them.
So, if our sources are too similar, then they’ll agree to readily – not really giving us the balanced picture we’re after.
I recommend looking for a momentum indicator to combine with a trend indicator when looking for a trade trigger. You can find my selection of momentum indicators HERE, and volatility indicators HERE.

JOIN US ...
Get full access to members-only resources, plus my weekly email updates ...
I will NEVER share your details for marketing purposes. Privacy policy
Strategies I'm Using
 It has taken 2 years to persuade this market…
- These videos show how to make 24% gains in…
 As you can see from all the data I've…
 Get the low down on the Heikin Ashi Mountain…





1 comment
Eric
Thanks for this. Improving my education.