October 14, 2016by Mark Rose- 5 comments
Linear Regression – there’s a new trend-finder in town
Most traders are familiar with adding a moving average to their charts – a line that’ll smooth out price movements, give an idea of trend direction and when a trend may be ending, and a new one beginning.
Less commonly used outside the world of ‘quants’ is linear regression …
The trend-finding indicator that ‘Quants’ love
While moving averages are about adding up previous levels and then plotting their average … linear regression is about drawing a ‘best fit’ straight line through those levels …

And the linear regression indicator then plots the ends of all these imaginary straight lines across our chart. The result is something that looks uncannily like a moving average …

But the linear regression indicator has less lag than a moving average, giving a more accurate picture of price levels, and will respond to changes faster.
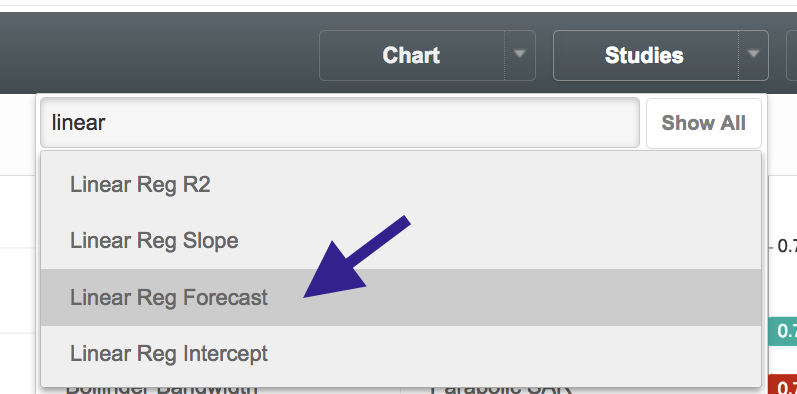
If you want to add this feature to your chart, it’s easy to find on the list of indicators …
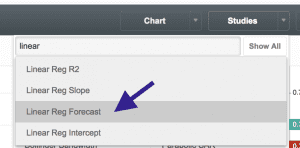
(I’ve used a setting of 14 periods for a daily chart.)
But before you start applying a linear regression curve like a moving average … a warning – the downside of its sensitivity is that it’s more prone to whipsaws. But it comes with its very own methods of measuring trend strength …
The Linear Regression slope
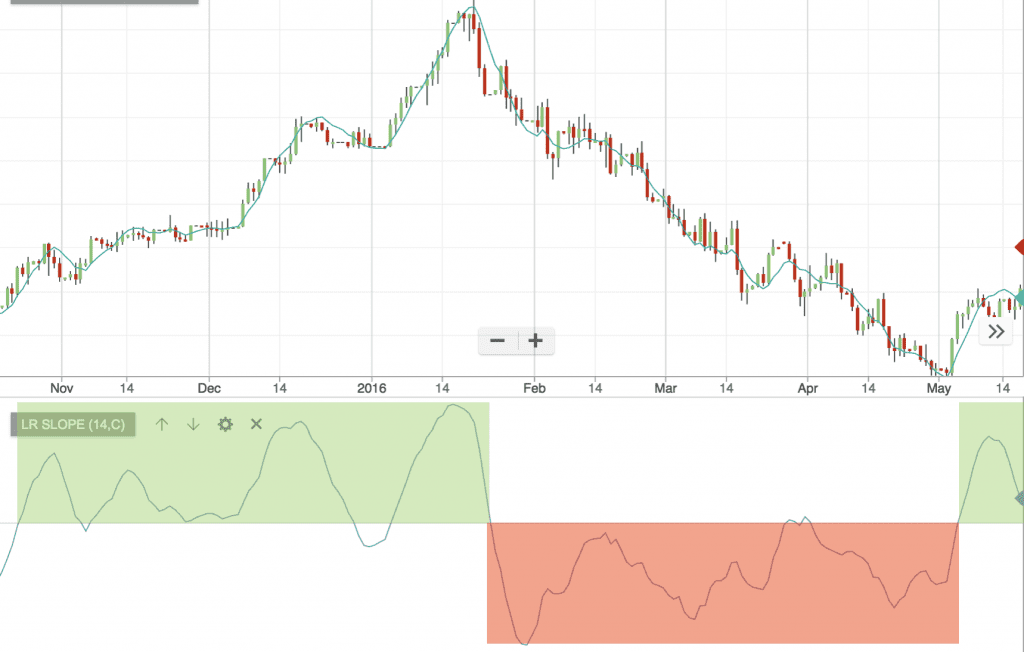
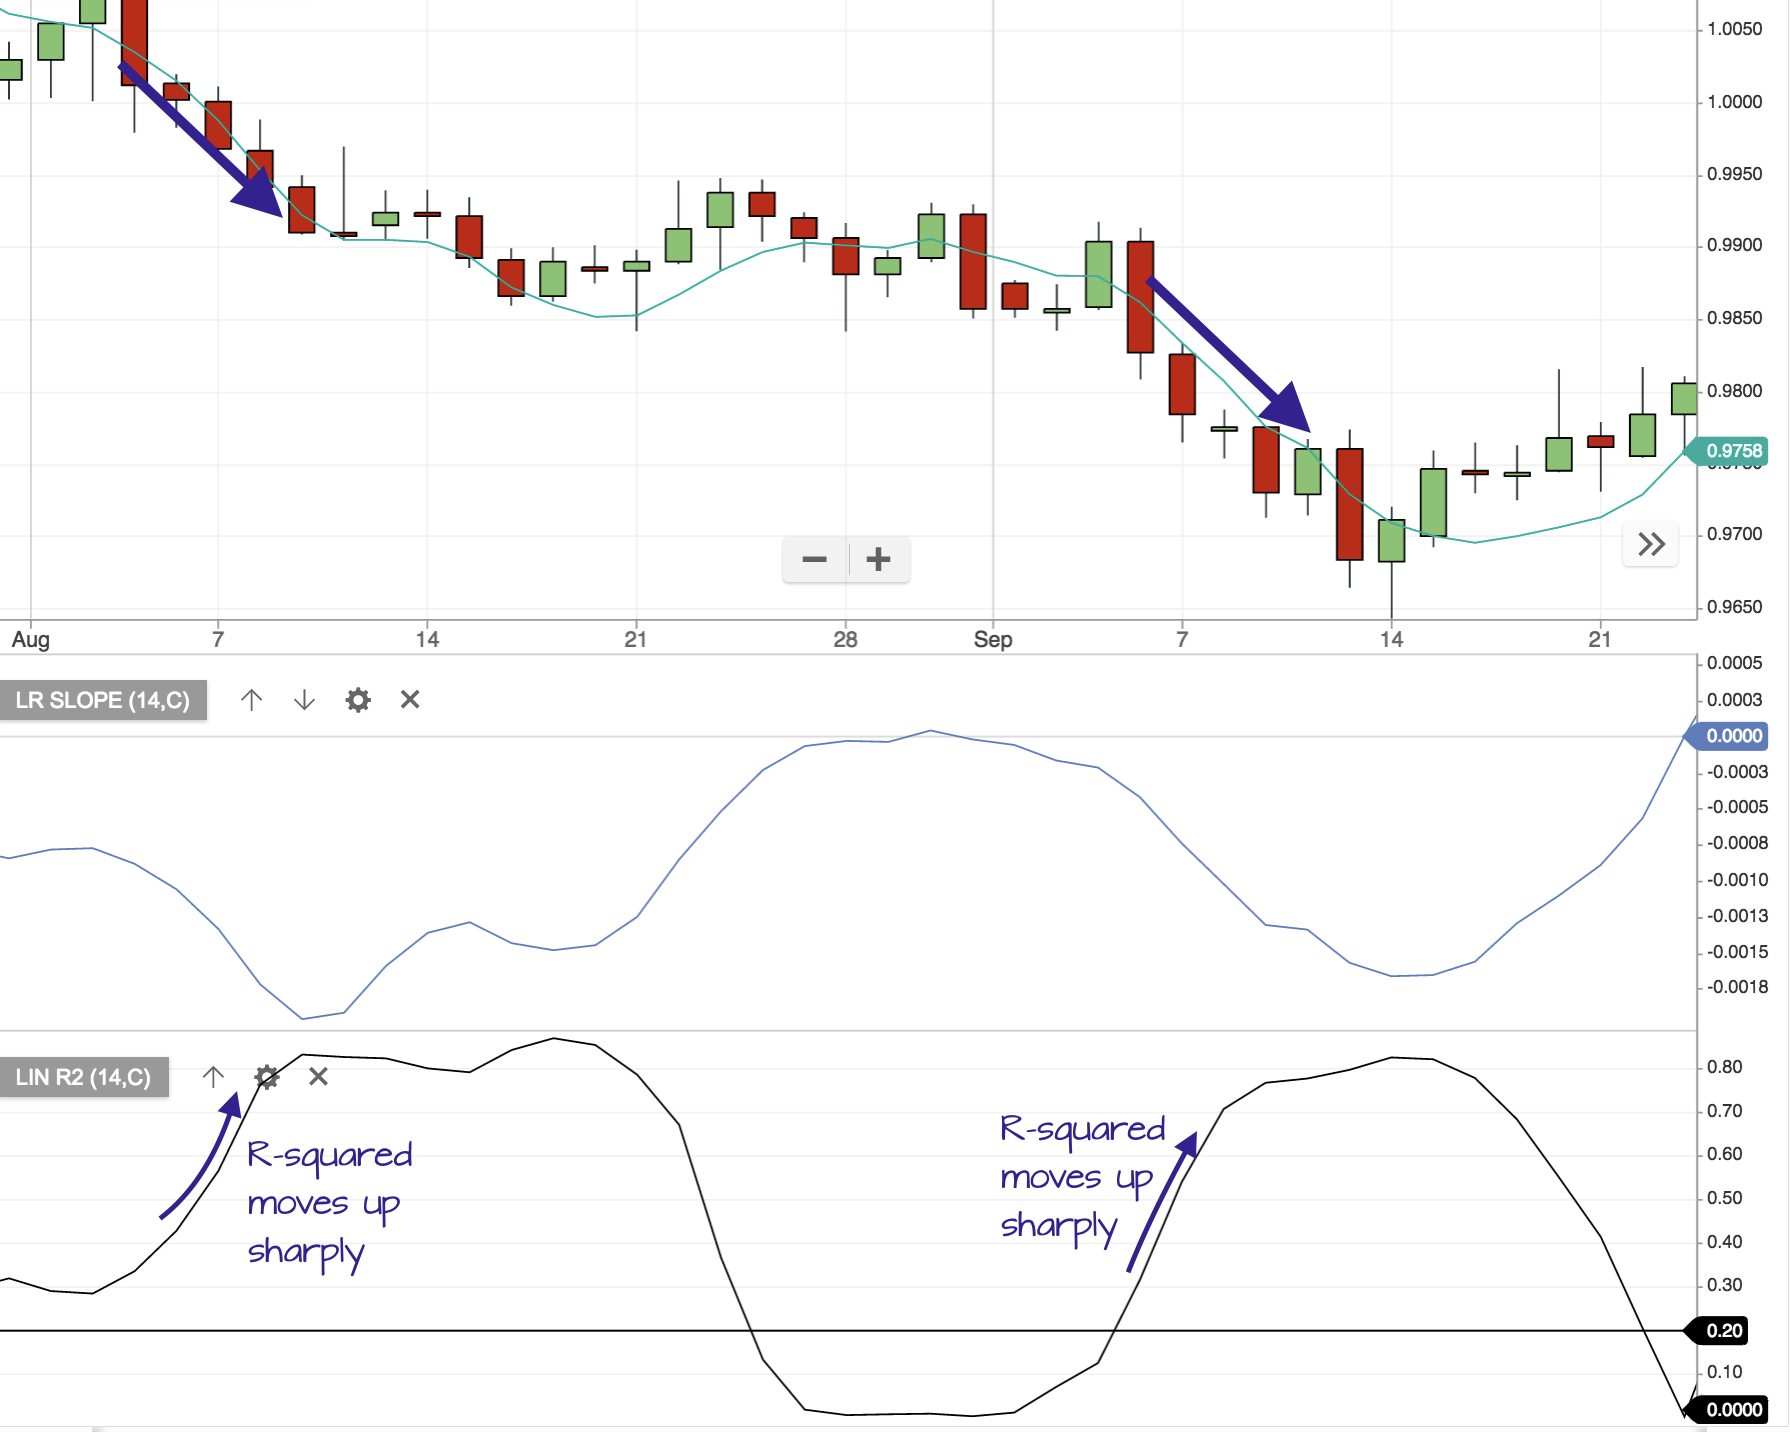
The slope indicator tells us about how quickly prices are moving by measuring how fast our linear regression indicator is moving – i.e. the angle it’s moving up or down at.
If the slope is in positive territory, then it indicates an uptrend. If the slope is in negative territory, it indicates a downtrend …
But there’s more …
The R-Squared Linear Regression Indicator
The R-squared indicator measures how far the price is away from our linear regression indicator. It’s measured from 0 to 1 – the higher the R-squared figure, the closer the price is matching our linear regression line. So, a R-squared level close to 1 means that the indicator and the price are closely correlated. A level close to 0 means they have deviated.
Don’t worry if the idea of correlation … square roots … and regression … are making your head hurt, because the upshot of all this is really very simple to understand – What’s key here is that a rising R-squared level is a sign that the price is moving into or resuming a trend. A falling R-squared level tells us that the trend is weakening.
Note on the image below that where the R-squared takes a sharp upward turn, we see a really neat trend, hugging the linear regression line.
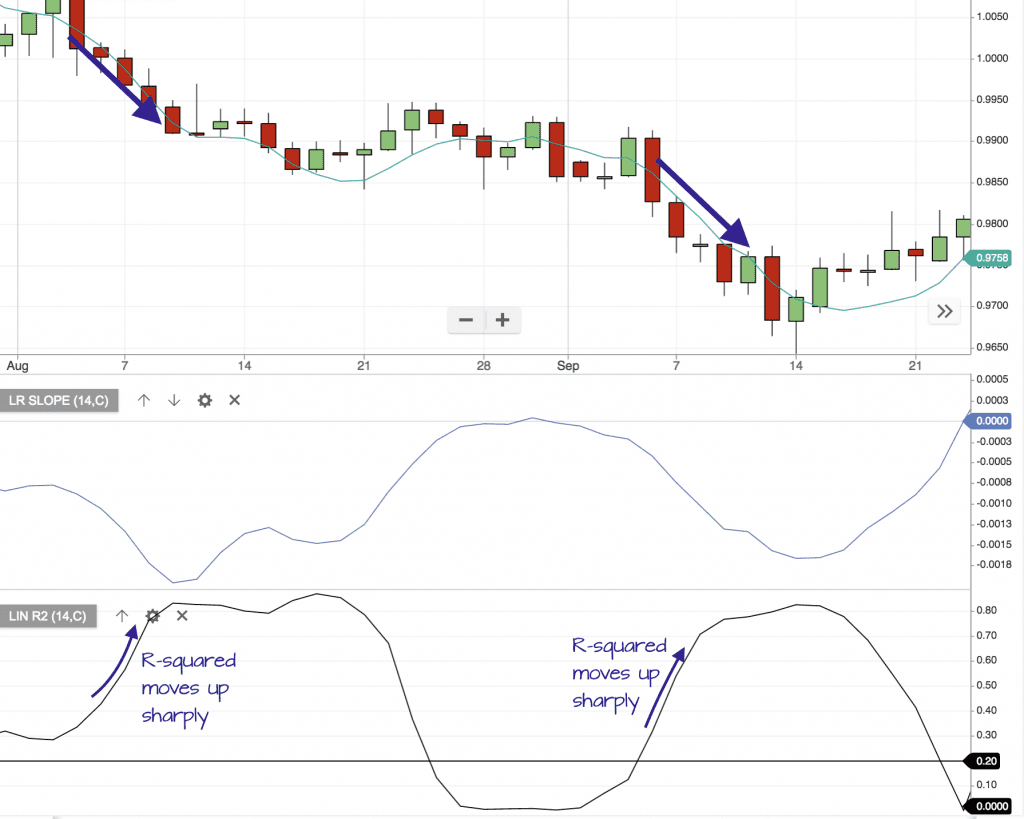
These short accelerated trend moves are the kind that us traders love to be in, so this is where the linear regression tool gets really interesting to me.
Exactly where you measure this up move on the R-squared from will vary depending on the timeframe you’re trading – we want to catch the acceleration early (but not so early that we’re risking false moves).
I’ve barely scratched the surface of this here – I’ll be coming back to this indicator very soon with some concrete trading ideas for you …
Save
Save
Save
Save
Save
Save
Save
Save
Save
Save











5 comments
David Hudson
Any further progress on this one Mark?
David
Paul H
Very interesting feature. The moving linear regression appears to give good warning of when price is running out of steam and likely to revert to its simple moving average and then bounce off it or break through it.
Cath
Interesting. What timeframe are you using it on? Thnx,
Cath
Just seen it was a daily chart 🙂 thnx
s m waller
Where can one get these indicators for an MT4 platform – they are not there on the basic platform.
Please don’t mention Core Spreads as this is the worst company on earth for customer service and charting!!!”