The best volatility stop indicators put to the test
Adding a volatility stop to your trade setups is a really powerful way to keeping your trades in-line with current market behaviour.
Volatility changes, from month to month, day to day, hour to hour, so fixed trading parameters can easily get us into trouble.
A volatility stop means that the leash tightens in when markets aren’t showing much activity, but loosens up when markets are running. And when we use these tools as a trailing stop, we get even more sensitivity to market behaviour while the trade is playing out.
Last week I looked at using the Average True Range indicator to measure volatility, but there are some smarter tools that’ll do the job for you, and I’m going to measure them up against each other …
1. THE AVERAGE TRUE RANGE VOLATILITY STOP
This indicator is our starting point for a volatility measure of an instrument. It gives us average range movements across previous candlesticks. The default setting is 14, so it’ll look at the average high-low over the last 14 bars and give us an average figure. It’s a good way to assess what kind of moves we can expect to see over the next few bars.
When used as a Volatility Stop indicator, traders will usually take a multiple of this figure to set the stop loss a nice safe distance away. This distance will be measured from the close of the previous candlestick …
2. KELTNER CHANNEL
This is a variation on the Average True Range that smooths out bumpy data and provides a more visual approach to where your stop should be positioned.
The Keltner Channel takes an exponential moving average of the ATR, then plots an offset of that either side of a moving average of the price on your chart. You can adjust the lookback period to make that line smoother, and you can adjust the offset for wider or closer stop distances …
3. BOLLINGER BANDS
Bollinger bands are another smoothed-out volatility measure. They’re measured from a 20period moving average, and plot the average deviation from that moving average over the past 20 periods. The standard multiple for the distance from the central moving average is 2x. As with the Keltner channel, the smoothing out process means that a tighter deviation can work better …
4. THE CHANDELIER EXIT
The Chandelier stop level is a souped-up version of the ATR stop. It uses a 22-period ATR, multiplies it by 3x, then plots this distance away from a recent high (for a buy trade) or low (for a sell trade).
These are its rules for placement:
Stop on a short trade = 22-period lowest low + 3x ATR
Stop on a long trade = 22-period highest high – 3x ATR
And it’ll look something like this …
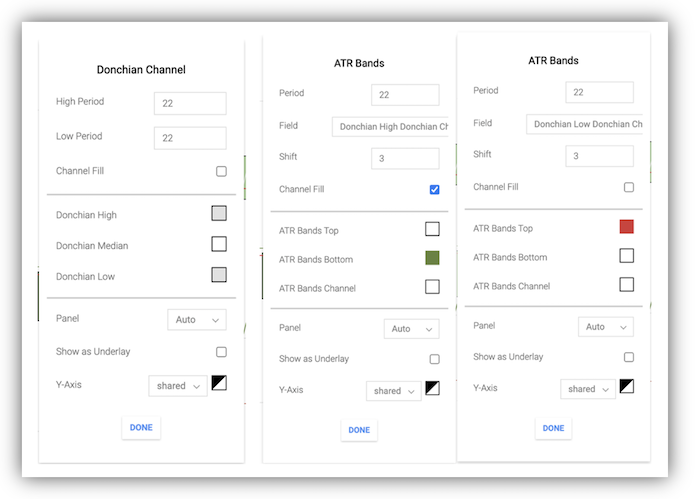
Adding the Chandelier exit levels to your chart is a little bit fiddly on Trade Nation, but you can do with a combination of ATR bands and Donchian channels, like this …
The Donchian channel sets the high/low for the past 22 period. Then the ATR bands are calculated from this Donchian High/Low to give us our two stop lines, in red and green.
HOW THESE VOLATILITY STOP INDICATORS HOLD UP AGAINST EACH OTHER
Here I’ve applied all four types of volatility exit to a chart, so you can see how differently they behave.
For a sell trade entered on the red arrow at 0.6611, you can see where each indicator would have stopped the trade out if used as a trailing stop: Bollinger band, Chandelier exit, ATR exit, and Keltner exit.
Note that trailing stops can only tighten in, never be moved out, so even if the indicator moves up, we’ll only ever move the stop down in a sell trade like this.
The deviation multiples can be changed on these indicators (in my settings, the Keltner and Bollinger bands both have a 2x multiple, while the ATR and Chandelier have a 3x multiple).
Here’s another example, also in a sell trade, but where the trend doesn’t really pick up any speed, so the trailing stops need to be working harder to reduce damage …
Note that the bulge on the Bollinger bands when momentum picks up means that, as a trailing stop, it doesn’t really work hard to lock in profits, while the ATR-based indicators do more to trail the price.
I recommend taking a look at these indicators on your charts to see what version of a volatility indicator would suit your trading style.