January 21, 2011by Mark Rose- 0 comments
Candlestick of the week: the harami

I owe you an apology
My wife tells me that I have a tendency to start things, and not finish them.
A quick glance at the half-assembled Ikea bookshelves on the floor of the spare room would add some weight to her accusations.
Another would be the email that I received this week from a Bulletin reader: “What happened to the ‘Candlestick of the Week’ series that you promised us?”
Apologies – in the flurry of exciting news that I’ve wanted to tell you about in recent weeks, I’d clean forgot about those candlesticks!
So, this week, we’ll kick off again – following on the Candlestick Quick-Reference Guide, and our first candlestick of the week, back in November – this week’s newsletter contains your next installment …
The harami is one of the most common candlestick patterns you’ll come across, so it’s important to recognize it – to understand what it means, and to understand its limitations.
A harami is a two-session reversal pattern, indicated by a small body of the opposite colour, completely contained by the body of the previous session. It is not essential for the two candles to be opposite colours, but this tends to give a more reliable signal.

As you can see here, the body of the small black candle is completely within the confines of the body of the previous white candle. This indicates that the upward trend is running out of steam.
Here are a couple of examples:
This bullish harami shows the sellers beginning to dominate as they come back into the market:
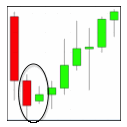
This bearish harami has a shadow that extends beyond the body of the previous candle – some traders wouldn’t regard this as a “true” harami. However, it’s body is entirely within the previous green candle, and a reversal follows:

I’ll be blunt with you – a harami doesn’t always live up to its hype. While it is touted as a “reversal indicator” – you may find yourself disappointed by its reliability.
The psychology behind a harami is that a possible change in sentiment may be happening. The small candle does not necessarily mean a strong reversal is coming. Often with a harami pattern, several days of tight range trading, referred to as “congestion” or “consolidation,” will follow. A harami on its own says “the chart MIGHT reverse.” It is best to look for confirmation and to combine the harami with other longer-term patterns.
Be aware of haramis, and watch for what they are telling you about market sentiment – but don’t have a blind faith in them.
Until next time,
Mark Rose