Correlation vs causation and Swiss frogs vs Danish birdlife
This week, a pitch invasion by thousands of frogs caused a football match in Switzerland to be abandoned.
This week also saw a report on a correlation between US stock-market performance and the number of firearm-related hospitalizations.
Cause and effect are not always as we expect them to be – and they are not always what they appear to be, but for successful trading it’s important to have an understanding of what markets affect others, and which move together.
In my trading, I hold a lot of store in market correlation.
There is very little that’s predictable in the markets, but market correlations are the closest we get to any level of certainty about prices.
My favourite type of trading is hedged trading – that way, I can pick up profits as markets adjust compared to each other (arbitrage) … while knowing that my back is covered if prices shoot off unexpectedly.
While I may track how prices are moving in relation to each other … I may keep an eye on fundamentals that affect these relationships … but what do I really know about the relationships between these markets?
And, does it really matter?
Correlation vs causation
It is said that the number of storks nesting on the roof of a Danish house has a direct correlation to the number of children born to that house. Is this because the storks bring the babies? Or because larger houses have larger roofs for storks to nest on, and more bedrooms for children?
Correlation is not the same as causation.
There’s a lovely website created by a Harvard law student with a passion for stats, Tyler Vigen (http://tylervigen.com/)
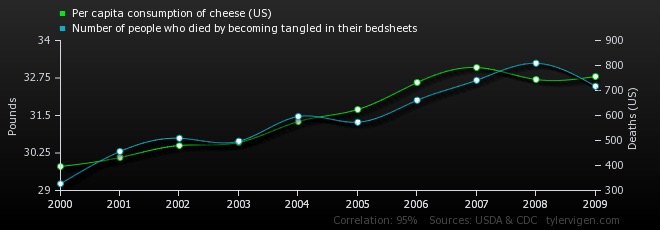
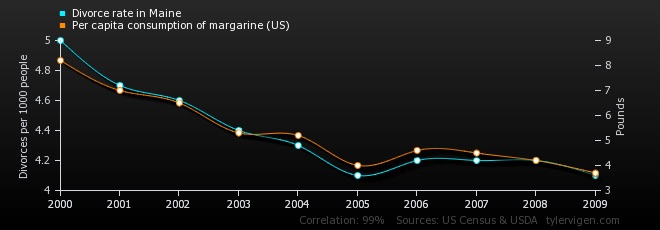
On this website, he tracks ‘spurious correlations’, such as the strong correlation between the consumption of cheese in the US and the number of people who died by becoming tangled in their bedsheets … or the divorce rate in Maine and the consumption of margarine.
Per capita consumption of cheese (US) correlated to number of people who died by becoming tangled in their bedsheetsDivorce rate in Maine correlates with per capita consumption of margarine (US)
These may look like the workings of a man who needs to get a new hobby, but Tyler’s website highlights the important interplay between correlation and causation.
So, should we ignore correlations if they have no causal back-up?
If you’re in any doubt about how important this stuff is … you need look no further than the tobacco industry’s campaigns.
In a US Senate hearing in 1965, an expert witness argued that while smoking may be correlated with lung cancer, a causal relationship was unproven. They likened the correlation between smoking and lung cancer to the storks and the birthrate.
Is it okay to demand a causal link?
So, what’s the difference between ignoring the unproven link between smoking and lung cancer … and ignoring a link between margarine consumption and happy marriages?
Every time we’re faced with these correlations – we make a judgment on whether there is a causal link based on our own knowledge, experience and prejudices.
The problem is that causal links are often very hard to prove, and are notoriously messy things, which is why it’s dangerous to discount a correlation just because you haven’t managed to pin down a link.
Plus, even without a direct causal link – correlations can give us very important information.
Let’s look at a financial example …
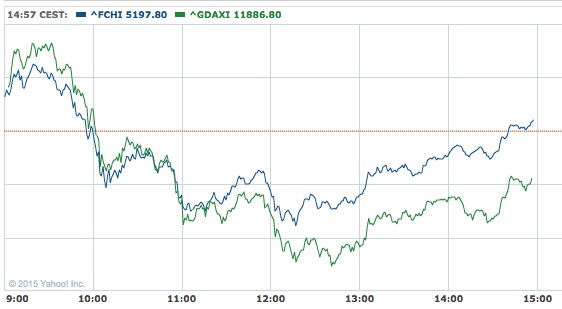
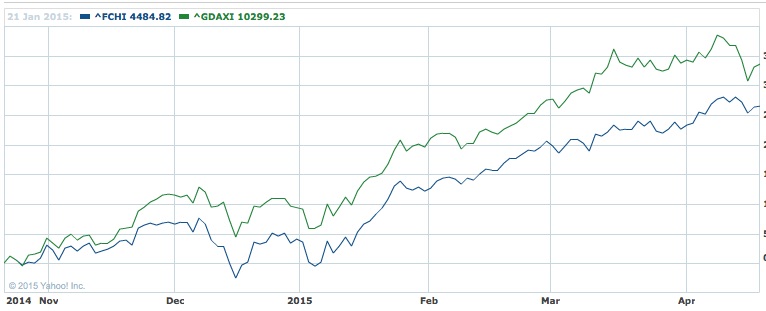
Here we have a correlation that’s close to my trading heart, the French CAC and the German DAX …
These two indices show a strong correlation short-term, over the course of a day …
And longer term, over the course of 6 months …
The mechanism linking the two indices is muddied by so many factors.
Yes, if the price of the DAX components look expensive, traders may buy the CAC components, so one price directly affects the other.
But the main drivers are external factors – economics in the Eurozone and beyond, trading conditions, currency fluctuations … all these affect both indices.
Like the storks and the birth rate – they can have a logical correlation, without a causal mechanism linking them. And for traders who want to take advantage of a correlation – this is perfect. We don’t want to be trading exactly the same thing, otherwise we’ll struggle to find arbitrage opportunities.
What matters with trading correlations
As correlation traders, we don’t worry that there’s no direct causal mechanism, but we do worry that the correlation is a logical one, rather than just a passing coincidence.
What’s vital is that we trust those correlations.
Any correlation will move into and out of perfect alignment. Without these wobbles, we wouldn’t have the opportunities to make money from our arbitrage trades.
But our correlation needs to be strong enough that we have faith it’ll come back into alignment.
Correlation, volatility and the markets right now
Some market commentators refer to the high levels of correlation in today’s markets as a ‘nowhere to hide’ market. The problem they have is that their previously diverse portfolio of stocks is now moving up and down together – it’s just not possible to find a good range of investments that have no correlation.
But, as savvy correlation investors, we’re not looking for diversity – we’re directly matching our investments to hedge each other.
Using correlation to our advantage.
One of the great things about correlations is that they are strongest when markets are in turmoil, which means that they’ll come good through the toughest of times.
If you’re not already using correlation in your trading, the perfect place to start is the Martin Carter’s Diff Code strategies. These simple, once-a-day systems have shown real staying power. You can get all the details HERE.
D.J. , Thanks for sharing your thoughts, and I’m sorry it’s taken a few days to get back to you.
I have to disagree about risk/reward ratios. I’ve banged on at great length on this website about the myth of trading with a positive ratio, which just isn’t sustainable in the long run (I won’t start on that here, but you can find my views here: https://www.tradersbulletin.co.uk/risk-reward)
Martin does test the system with 2:1 and 1:1 ratios, and they consistently underperform his 1:2 ratio. And wide stop losses will always outperform tighter ones in testing (https://www.tradersbulletin.co.uk/alarming-truth-about-your-stop-order). Brokers like us to use tight stops, they give us a nice feeling of security – but we pay dearly for that.
Regarding results for Diff Code Oil and Europe, they have been experiencing drawdowns recently, but this is always a part of trading. I appreciate the frustration this causes when a drawdown occurs just as you’ve joined a system.
To put it into a long-term perspective, Europe is up over 100% since July 2014; and Oil, which has suffered with recent trading conditions is only up a little over 10% in that time. I publish all these results on the Diff Code Europe and Diff Code Oil review pages on this website – I’m not aware of any publisher who presents such transparency and honest reviews.
When you tested Diff Code you always compared the number of wins with the number of losses, but you never mentioned the actual profits or losses accrued. Since the potential loss per trade is invariably double the potential profit – a risk/reward ratio of 1:2 – it requires the number of wins to be at least double the number of losses just to break even. In my experience any strategy with a risk/reward ratio of 1:2 is fundamentally flawed and doomed to eventual failure. It would require a consistent strike rate of at least 70%, which Diff Code is not achieving. It is nearer 50% which is about the same as could be expected by tossing a coin. I also consider that any relatively short term strategy which require a stop loss of over 200 points is highly suspect.
My own figures for the year so far illustrate my point/
Diff Code Europe has had 25 wins & 16 losses, but despite the greater number of wins, it is currently showing a loss of 246.7 points. Diff Code Oil has done better with 25 wins and 12 losses and is showing a profit, but only 40.5 points which is heavily outweighed by the losses on Diff Code Europe. Hardly a success story.








2 comments
Mark Rose
D.J. , Thanks for sharing your thoughts, and I’m sorry it’s taken a few days to get back to you.
I have to disagree about risk/reward ratios. I’ve banged on at great length on this website about the myth of trading with a positive ratio, which just isn’t sustainable in the long run (I won’t start on that here, but you can find my views here: https://www.tradersbulletin.co.uk/risk-reward)
Martin does test the system with 2:1 and 1:1 ratios, and they consistently underperform his 1:2 ratio. And wide stop losses will always outperform tighter ones in testing (https://www.tradersbulletin.co.uk/alarming-truth-about-your-stop-order). Brokers like us to use tight stops, they give us a nice feeling of security – but we pay dearly for that.
Regarding results for Diff Code Oil and Europe, they have been experiencing drawdowns recently, but this is always a part of trading. I appreciate the frustration this causes when a drawdown occurs just as you’ve joined a system.
To put it into a long-term perspective, Europe is up over 100% since July 2014; and Oil, which has suffered with recent trading conditions is only up a little over 10% in that time. I publish all these results on the Diff Code Europe and Diff Code Oil review pages on this website – I’m not aware of any publisher who presents such transparency and honest reviews.
D.J Stevenson
When you tested Diff Code you always compared the number of wins with the number of losses, but you never mentioned the actual profits or losses accrued. Since the potential loss per trade is invariably double the potential profit – a risk/reward ratio of 1:2 – it requires the number of wins to be at least double the number of losses just to break even. In my experience any strategy with a risk/reward ratio of 1:2 is fundamentally flawed and doomed to eventual failure. It would require a consistent strike rate of at least 70%, which Diff Code is not achieving. It is nearer 50% which is about the same as could be expected by tossing a coin. I also consider that any relatively short term strategy which require a stop loss of over 200 points is highly suspect.
My own figures for the year so far illustrate my point/
Diff Code Europe has had 25 wins & 16 losses, but despite the greater number of wins, it is currently showing a loss of 246.7 points. Diff Code Oil has done better with 25 wins and 12 losses and is showing a profit, but only 40.5 points which is heavily outweighed by the losses on Diff Code Europe. Hardly a success story.