Day trading with pivot points: pivot point setups you can apply now
I’m not keen to overcrowd my charts with indicators and lines, but if you aren’t using pivot points in your day trading, how are you judging your turning points?
Add these simple lines to your short-term trading, and you’ll wonder how you ever coped without them. Here’s everything you need to know to get started …
What are pivot points, and why do you need them?
If you’re faced with a price chart, you want to know what levels prices are headed to, and where they might bounce. Pivot points can give us some clear guidance on this.
Day traders use pivot points to give a clear set of levels each day that can act as support and resistance.
Pivot points are calculated on the previous day’s high, low and close prices, and are based around the idea that prices tend to be drawn back to an ‘average’ – this makes them particularly useful for Forex trading.
The charting package on most brokers will draw in pivot points for you, so you don’t have to worry about the calculations behind them.
The image below shows pivot points for 3 days on EURGBP, as drawn in on my Trade Nation account.
The thin black line applied to each day, is the central pivot point, and this will have three (sometimes more, sometimes fewer) resistance levels above it, and support levels below.
As you can see in the image above, prices don’t always neatly bounce off these levels, but they are clearly exerting some effect on price behaviour.
What do pivot points do?
Like all levels of support and resistance, pivot points have a push/pull affect on prices. You’ll notice that prices tend to move rapidly between pivot points, pulled to them like a magnet. But then get ‘stuck’ around these levels, struggling to pull away from them.
And one of the best things about pivot points for the day trader, is that they will always be there in the area of our trading range. With short-term trading, it can often be tricky to find a strong key level in historical support and resistance – there may just not be anything really useful within the trading range of that day. But, unless the price is really powering off in one direction, there should always be a nearby pivot point.
Central Pivot Midnight Magnet
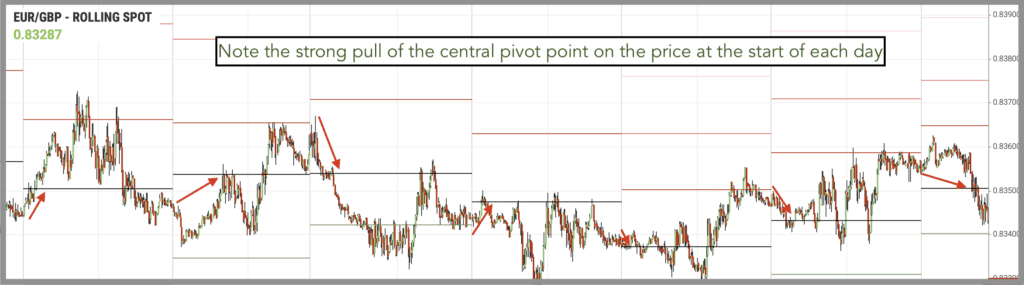
The more central the pivot point (i.e. the closer it is to the Central pivot point), the stronger its pull will be. And the strongest magnet comes from the central pivot point itself.
Take note of how the first thing the price does each day in the examples below is to touch that central pivot point …
Pivot Point London Open Setup
Pivot points are measured based on the previous day’s trading high, low and close prices, which means that the exact time we switch from one day to the next will affect the levels. Because we’re looking at global Forex markets, this can be complicated – obviously countries around the planet hit midnight at different times!
Many Forex traders will use midnight GMT as their daily switchover time. Others will use the New York closing time of 4pm EST.
Personally, I stick with midnight GMT – it’s simplest for me, being in the UK already, and the time between the US close and midnight in the UK does not tend to be a busy one in the markets I follow, so shouldn’t have a big impact on my levels.
The reason I’m digging into this a little is because I want to look at the market behaviour in relation to the pivot points AFTER the London open …
This set-up looks at the price level at 8am in relation to the central pivot point. If we’re below the central pivot point, we’ll look for a sell trade. If we’re above the central pivot point, we’ll look for a buy trade.
The stop level should be tucked WELL above the central pivot point – we know that the price is naturally drawn to this level, and tends to consolidate around it, so a stop tight to this pivot would be vulnerable.
Profits can be taken 50% at S1 and 50% at S2. In the example above, the price even ran down as far as S3.
Pivot Point Day Trading Tips
There are a few key pointers to watch out for when trading pivot points …
Watch out for historical support and resistance points – these tend to be more powerful than pivot points alone, so should also be marked onto your chart as potential consolidation areas.
Pivot points are most powerful early in the day. As the day progresses, other factors come into play, affecting price behaviour.
Price action around pivot point levels is often ‘messy’, so beware placing stop levels too close in – give your trades room to breathe. Be mindful of your risk-reward profile in pivot-point setups. The S & R lines are not evenly spaced, so ensure your trade setup offers enough reward for the potential risks involved.
Thanks for the bulleting and talking of Greg and Fire, have you come a cross any software / spreadsheet that calulates option trades. My original option traders (American) have a very convulted and tedious set on the platform so I just wondered if you knew of anything simple?
Greg has produced quite a comprehensive set of spreadsheet he and his members are using, but of course you would need to join FIRE to get access to these. unfortunately I’m not aware of any free spreadsheet for this.













2 comments
Tym Mastin
Hello Mark
Thanks for the bulleting and talking of Greg and Fire, have you come a cross any software / spreadsheet that calulates option trades. My original option traders (American) have a very convulted and tedious set on the platform so I just wondered if you knew of anything simple?
Kind regards
Tym
Mark Rose
Hi Tym,
Greg has produced quite a comprehensive set of spreadsheet he and his members are using, but of course you would need to join FIRE to get access to these. unfortunately I’m not aware of any free spreadsheet for this.
Regards,
Mark