April 11, 2014by Mark Rose- 2 comments
Engulfing candles: the Cinderella of chart patterns
If anyone knows just one candlestick, it’ll be the doji (or pin bar) candle.
It’s like the celebrity of candlesticks.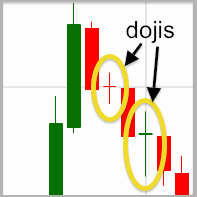
But dojis can be fickle. For a start, they don’t show up that often, so we may have to look through a lot of charts and wait a long time to find one (that’s not necessarily a bad thing) … but when it does show up, the message that a doji gives us is … indecision.
A doji tells us that the market went up … it went down … and ultimately couldn’t decide which way it wanted to go … so it settled back where it started.
Now, I’m not here to knock the doji … but I do want to tell you about a candlestick pattern that’s too often overlooked by traders. It’s one that pops up very regularly, and it has a very strong message about market direction …
It’s the Cinderella of candlesticks … the engulfing pattern.
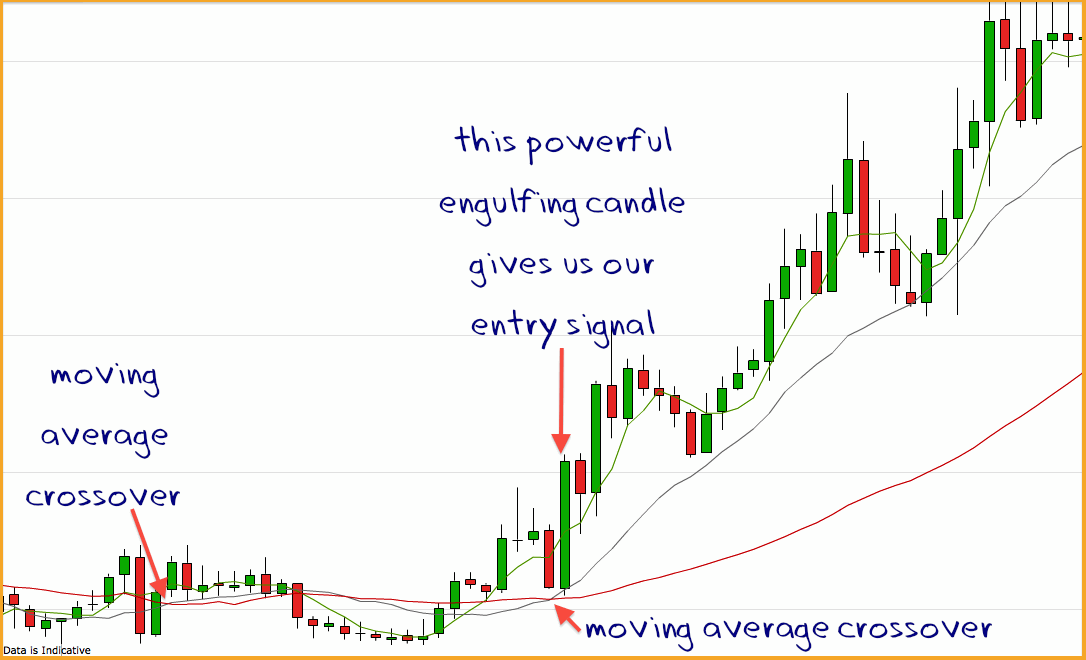
An engulfing pattern consists of two candles, where the second candle has a different colour to the first, and is larger, engulfing the entire body of the first candle. (Sometimes it will engulf the wicks of the previous candle too, which makes it even stronger.)
For it to be bullish, the first (small) candle is red, and the second (large) candle is green.
And vice-versa for a bearish engulfing pattern.

The beauty of engulfing patterns is that they are very common and that they give a clear indication of market direction.
How do we add engulfing candlesticks to our trading?
The first rule with applying any candlestick to your trading is not to use them in isolation.
Candlesticks need context.
Successful candlestick trading involves finding the right candlestick pattern in the right place.
Because our engulfing candles are so common, we need to be careful to filter out the less-relevant ones and only listen to the ones that are going to make us money. They crop up all over the place, showing short, sharp directional changes. But we only want the ones that show a directional change that has legs – i.e. one where we can ride that move for a healthy profit.
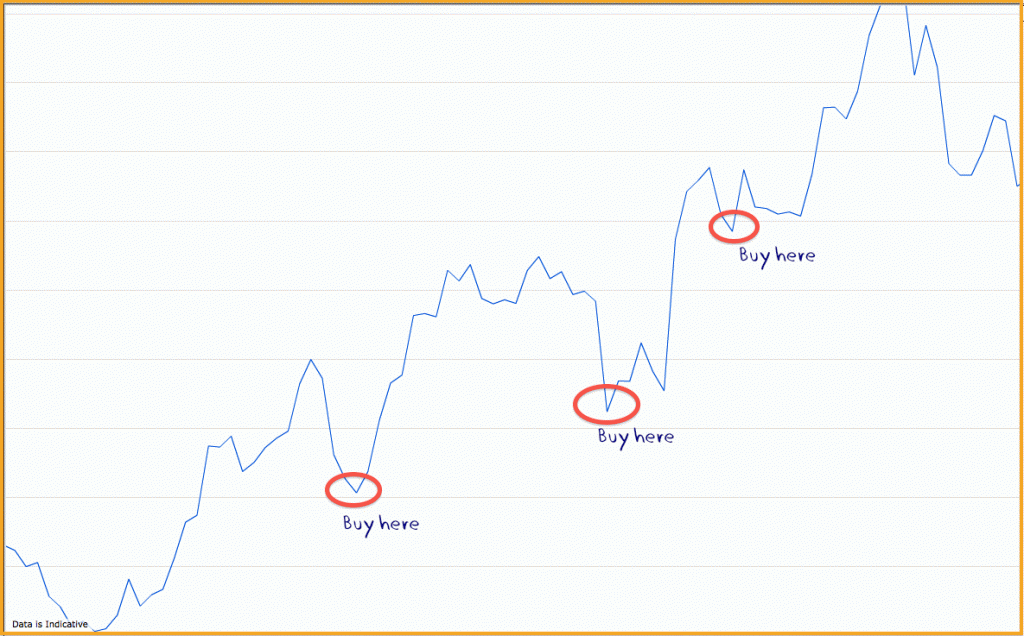 In my opinion, the very best way to do this is to follow trend.
Trading in the direction of the trend automatically puts us at an advantage. And the best entry for any trend trader is directly after a pull-back – as shown in the chart on the right.
This is where our engulfing pattern comes in – telling us when the pullback is over and the trend has resumed.
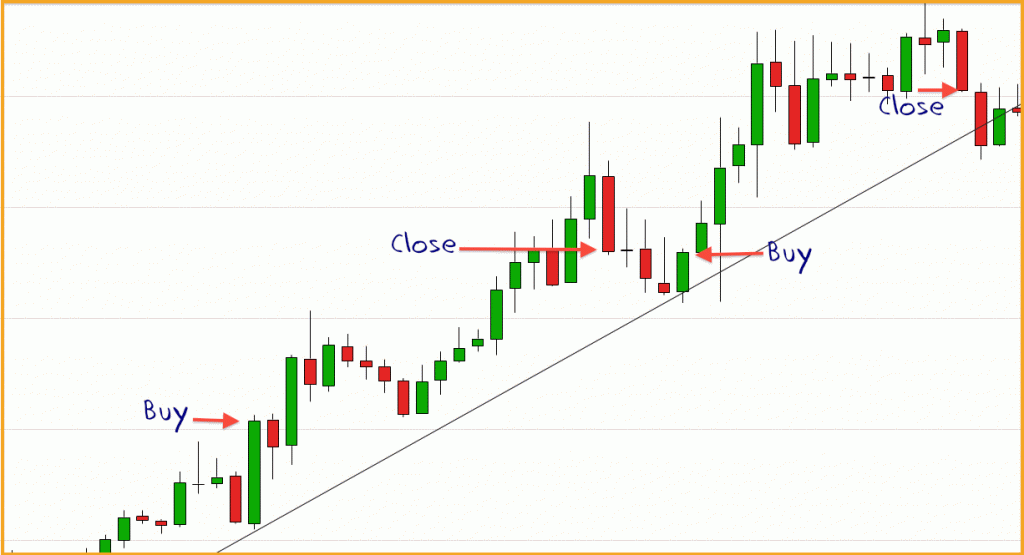
On the chart below, we can see the price repeatedly pulling back to a rising trend line, with two engulfing candlestick patterns clearly falling on that trend line, signifying the end of the pullback.

Or, if you’re using moving averages to follow a trend …
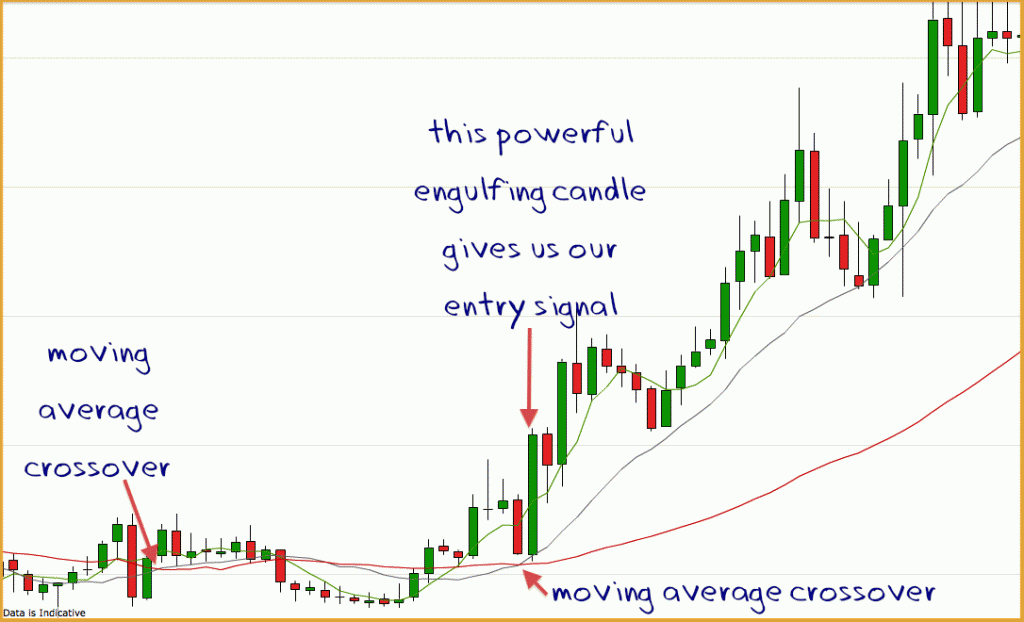
On the chart above we can see two instances of a moving average crossover giving a buy signal, but only the second one is combined with an engulfing pattern, which confirms the bullish move.
Engulfing candles can also help to get us out of trades …
Another good way to use an engulfing candle is as a signal that a trend is coming to an end and that it’s time to get out of our trade.
Take another look at the charts above, and our buy trades could have been closed for a nice profit on the next bearish engulfing candle …
How to time your engulfing entries …
The standard practice for entering a trade on a candlestick pattern is to wait for that pattern to complete … for the candle to close … and the next candle to begin.
However, one of the downsides with engulfing candles is that they can be big. In fact, the bigger they are, the stronger the move they are indicating. But that also means that we could have missed a significant part of the price move.
Which is why I thought I’d take a look at a more controversial technique …
Recently I’ve been looking at a trading style that gets around this by trading candlestick patterns live … i.e. taking the shape that you see in the candles at the moment it’s happening, rather than waiting for a close.
So, if an engulfing pattern appears on our live charts, it doesn’t matter that that engulfing candle then shrinks back to form a doji … or even heads off in the wrong direction – we had an engulfing pattern at a moment in time, and that’s all it takes …
For someone like me, who’s been brought up on the mantra of “wait for the candlestick to close” – it’s a tough principle to trust. My inclination, if you can’t wait for a candlestick to form, is that you should move into a shorter timeframe instead.
But I’m always keen to give new things a try, so I plan to test this out in a demo account – I’d be really interested to know if any Bulletin readers use this technique, and what kind of success you might have had with it.
Applying this to your trades right now
But my advice remains to look for (ready formed) engulfing candlesticks at your key levels to confirm your trades. This can help filter out the weaker signals and get you into the bigger moves. So you can sit back and watch for your success rate take a boost.
Save
Save
Save










2 comments
Darin
Might give this a go on a Demo also. After experiencing a dodgy relationship with Doji’s using a certain system, this may be a better way to fly-and it doesn’t require me to spend more money up front!
nev
You could look to the 30 minute sling shot pattern as that sometimes turns into an hourly engulfing pattern.