Got some ideas for trading strategies that you want to try out? Where do you begin to build a robust system?
Here’s what you need to know …
Before you start trawling through old charts, write down your trading rules.
They don’t necessarily need to be complicated, but they do need to be clear enough that you can look at a historical chart and say, with reasonable certainty, whether you would or wouldn’t have taken a trade.
Perhaps you’re testing an opening-range breakout strategy. What is your range period? When do you enter? When do you exit? How long do you give the signal to trigger?
The important thing is to make those decisions before you see the result of the trade. Otherwise, hindsight has an irritating habit of creeping in. You find yourself looking at a losing setup and thinking: I probably wouldn’t have taken that one because the trend wasn’t quite strong enough.
If you can’t apply your rules consistently to old data, they’ll be even harder to apply when there’s money at stake.
Don’t build a strategy that’s brilliant at trading the past
This leads to one of the biggest dangers with backtesting: curve fitting.
Let’s say you test 50 trades and discover that Tuesdays perform badly. So you remove Tuesdays.
The results improve.
Then you notice that trades after 11am don’t perform very well either, so you remove those. Perhaps a 17-period moving average works better than a 20-period one. And you’d do even better if you went for a bigger target during months beginning with the letter ‘A’ …
Keep going for long enough and you can create an absolutely beautiful historical equity curve.
The trouble is that you haven’t necessarily discovered a better trading strategy. Instead, you’ve simply have built a very accurate description of what happened in the past.
A strategy needs a certain amount of robustness. I’m far more interested in something that works reasonably well across a wide range of conditions than something that produces a perfect historical equity curve. The real test is whether it can deal with the new data arriving from the right-hand side of the screen.
Optimisation is useful – but only if you do it properly
None of this means that you shouldn’t optimise a trading strategy.
Optimisation can be enormously useful. For example, you may genuinely want to know whether a 20-point stop, 30-point stop or 40-point stop has historically worked best. You might want to compare different profit targets, entry times or volatility filters.
But there’s an important rule:
Don’t use the same data to optimise a strategy and then use that data as proof that the strategy works.
Suppose you have ten years of historical data. If you run hundreds of different combinations across all ten years and eventually find a particular set of parameters that performs brilliantly, that isn’t really an independent test. You’ve deliberately selected the combination that best fitted those ten years.
It’s a bit like getting sight of the questions before an exam. You might get a great score on the test, but you won’t have the depth of knowledge of someone who didn’t know what would come up.
Here’s the right way to do it … split your historical data into two parts.
You might use 2018–2023 as your in-sample data. This is the bit you’re allowed to experiment with. Change your parameters, investigate ideas and optimise your strategy.
Then stop.
Lock the rules down and test them on, say, 2024–2025 – your out-of-sample data. This second period should ideally have remained untouched while you were developing the system.
If the strategy still performs reasonably well, that’s far more encouraging.
And notice I said reasonably well. I don’t expect the out-of-sample results to be as spectacular as the optimised results. In fact, if they are, I might become slightly suspicious.
I’m also wary of optimisations that reveal one magical setting. If a 29-point stop loses money, a 30-point stop makes a fortune and a 31-point stop loses again, that’s probably not an edge I’d want to trust with much money.
I’d rather see a broad plateau where, perhaps, stops between 25 and 35 points all work reasonably well.
That’s a much healthier sign of robustness.
You can take this idea further with walk-forward testing, where you optimise on one block of data, test on the next, then move everything forward and repeat the exercise. But the principle remains the same: some historical data is used to develop the idea and some is reserved to challenge it.
Let the computer do the boring stuff
Technology has made all of this enormously easier.
When I started trading, properly testing hundreds or thousands of trades generally meant sitting in front of a chart and working through them manually. These days, platforms such as MT4 can test a coded strategy over years of historical prices in a matter of minutes. You can then change a parameter and run the whole thing again.
This is incredibly useful.
A computer doesn’t get bored after trade number 137. It doesn’t accidentally skip a losing trade because it’s nearly lunchtime, and it can compare hundreds of combinations far faster than any of us could do manually.
But there’s a danger here too.
A faster backtest isn’t necessarily a better backtest.
The obvious danger is that computers will follow whatever instructions you give them – including bad ones. If there’s an error in your code, you can generate thousands of completely meaningless trades with impressive-looking statistics attached to them. Always look through charts to ensure that the numbers match what you’re seeing.
But the big limitation is in the underlying price data. Your testing software may not know exactly what happened inside a historical candle. Broker prices vary, spreads change, slippage happens, and a market that looks perfectly tradable on historical charts may have been rather less accommodating in real life. This can affect where we get in and out of trades, and will influence technical indicators which are calculated from these levels.
Seemingly trivial things like how a broker defines the trading day, handles a Sunday evening session or records a particular minute of price data can alter the result.
You really need to understand what the computer is actually testing. If a result looks unusually good, investigate it. Look at individual trades. Check that entries and exits are happening where you expect them to. Make sure the spread, commission and other trading costs are realistic.
And don’t underestimate manual testing either.
Working through charts by hand is much slower, but it forces you to actually see how the strategy behaves. You’ll notice the horrible choppy periods. You’ll see how the market behaves around your entries. And if the strategy involves an element of judgement manual testing may actually be more meaningful than attempting to force every decision into computer code.
Often, I think the best approach is a combination of the two.
Use technology to do the heavy lifting, but get your hands dirty and inspect what it’s telling you.
Don’t just count the winners
However you test, make sure you’re gathering enough information.
I’ve written previously about the dangers of judging a trading strategy from a handful of results. Ten trades tell us virtually nothing. Thirty trades still contain an enormous amount of noise. Once we get into hundreds of trades, we can start building a much more useful picture.
As a rough guide, I like to see at least 200 backtested trades, although that obviously depends on the type of strategy you’re testing.
And don’t just record the win rate.
Look at the size of the average winner and loser, expectancy, maximum drawdown and the longest run of consecutive losses. These are the things that tell you about how tradeable it is in the real world.
Then stop looking backwards
Eventually, you need to stop developing the strategy and allow new market data to test it.
That’s where forward testing comes in.
Run exactly the same rules on a demo account, or record the trades on paper as the signals happen. Don’t keep tweaking things because you’ve just had three losers. The whole point is to discover whether the edge you found in historical data survives when faced with prices it has genuinely never seen before.
Forward testing will also expose problems that historical testing may have missed.
Perhaps the spread regularly widens at exactly the time your strategy enters.
Perhaps you’re assuming an entry price that’s difficult to achieve in practice.
Perhaps the signals occur when you’re rarely sitting at your screen.
Or perhaps a setup that looked beautifully obvious when you were scrolling backwards through a chart turns out to be surprisingly ambiguous in real time.
That’s why demo trading remains useful long after the beginner stage. It lets us test not just whether the underlying idea works, but whether we can actually trade it properly.
Again, I’d like a reasonable sample. My ballpark figure is around 100 forward-tested trades before placing too much faith in the results.
Finally, risk some real money – but not very much
If the strategy survives all that, there’s one final stage: live testing.
Start small. Because there’s one thing that neither a spreadsheet, a computer backtest nor a demo account can reproduce. You.
Real money changes things.
That five-trade losing run suddenly feels much more significant. You hesitate before taking the sixth signal. You close a winner early because you don’t want to give back the profit. Or you convince yourself that today’s setup “doesn’t look quite right”.
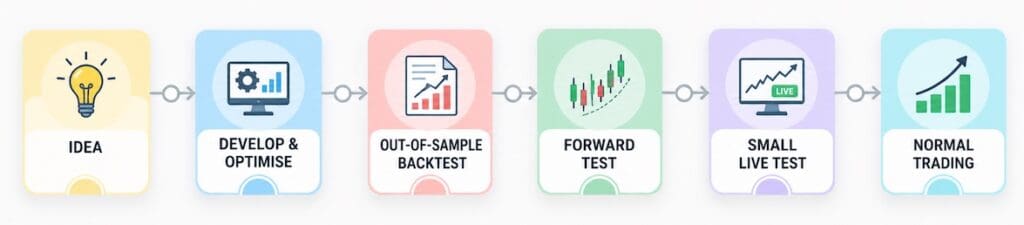
So, for me, the journey of a new strategy looks something like this:
Each stage is trying to answer a slightly different question.
Does the idea make sense?
Can I find an edge in historical data?
Does it still work on historical data I didn’t use to build it?
Does it survive completely new market data?
Can I actually execute it in real trading conditions?
And finally, can I trade it consistently when there’s money involved?
We’ll never reach the point where we know a strategy will keep working forever.
Trading doesn’t give us that luxury. But if you’ve tested an idea properly, the next time you hit an ugly losing run you can ask a much more useful question than “Does this strategy still work?”
You can ask: “Is what’s happening now still within the range of outcomes I saw during testing?”
That’s a much better basis for making decisions.
And considerably cheaper than finding out by trial and error with your trading account.