Leading and lagging indicators – how to find the perfect balance
There are two types of indicator: leading and lagging.
The leading indicator is the one that nudges the investor to look up at their screens, because something might be about to happen.
The lagging indicator, on the other hand, tells us
that something has already happened.
It’s easy to see why traders would be drawn to
leading indicators, which can give us a heads-up, and get us into trades nice
and early. However, both types of indicators are prone to false signals – with
leading indicators giving signals to events that just don’t happen, and lagging
indicators telling us too late, when the market has already changed direction.
Let’s look at them more closely to see how they are
different, how they’re similar … and how we can get the best of both.
Lagging Indicators
Lagging indicators follow the price. They tell us
that the market has moved. You could be forgiven for wondering why you’d want
to know what’s already happened … but the past is crucial in helping us plan
for the future.
An example of a lagging indicator is a moving
average.
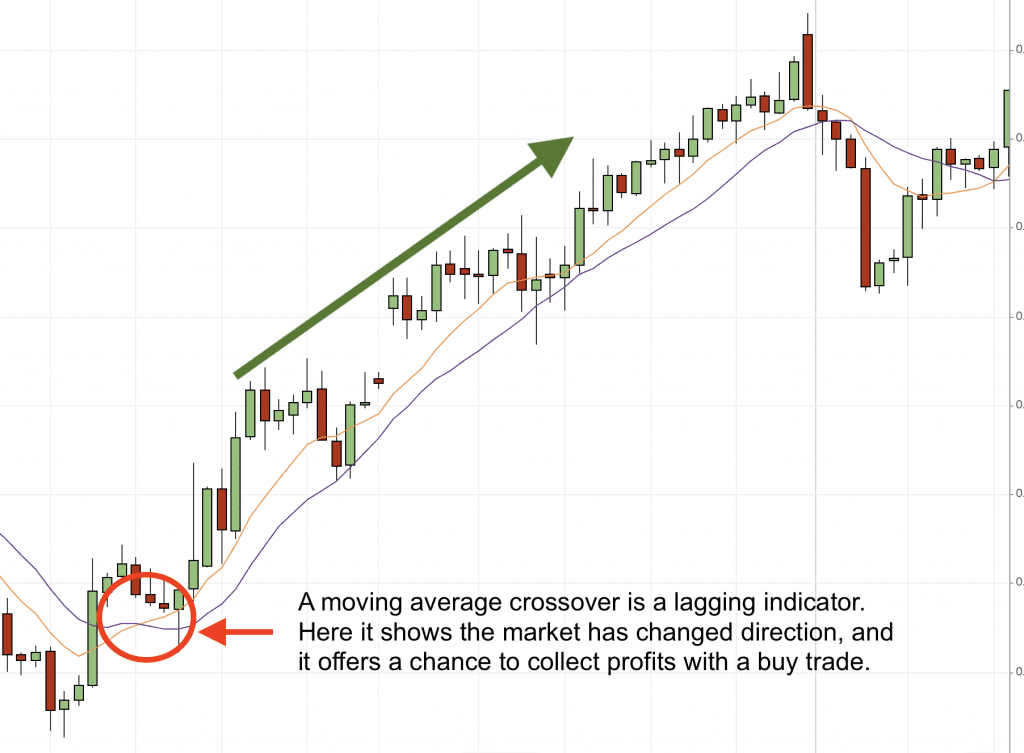
When the moving average changes direction, or when
two moving averages crossover, it tells us that the price has changed
direction.
This gives us the chance to get into a trend and potentially make some money.
But the problem is that the change has already happened (a few candlesticks ago) and it’s very possible that the move is over by the time we’ve got our signal. Try to get into the trend now and you may find the price has turned again, and you’re into a losing trade.
So, lagging indicators are a waste of time?
Not at all.
It’s about using them correctly. Lagging indicators
can make perfectly good trade signals as long as you accept that they will
often miss the move.
A good lagging indicator strategy will be about catching longer term trends. This means that multiple false signals need to be cut short, while those occasional lovely long trends are allowed to run and run.
In the chart above, we can see two losing trades,
followed by one winning one. Provided we have an exit strategy that cuts the
losing trades quickly, but lets the winning trade run for extended profits –
this type of trading can work. It will often involve a low success rate for
trades, and the use of trailing stops.
As ever, it’s more about successful trade
management than about overly complex signals.
Leading indicators
To anyone who’s missed the move on a slow lagging
indicator, a leading indicator may seem like the perfect solution.
These are technical indicators that claim to have
predictive powers about the way prices are going to act.
They take the form of tools like candlestick
patterns, momentum oscillators and volume measures. And they’re looking for
signs of market sentiment changing, that a trend could be running out of steam,
for example, or about to have an explosive breakout, so traders can take pre-emptive
action.
The problem is that – while lagging indicators fail
when they miss the action – leading indicators make predictions that never
happen.
The chart below shows buy and sell trades triggered by a Stochastic indicator …
While it would be possible to get a profit out of
some of these signals, it would be tough to build a successful strategy with
this kind of of sensitive ‘trigger happy’ signal.
We can use leading indicators as signals, but (just
as with lagging indicators) we should be incredibly careful with risk
management to offset the losing trades caused by false signals.
So, if both leading and lagging indicators will let
us down …
What’s the solution?
Let’s see what we DO have …
Leading
indicators give us an idea of sentiment, but often this doesn’t turn into
action.
Lagging
indicators tell us about trends, but only after they’ve formed.
By combining these two pieces of information, we
can create something considerably more powerful than its parts.
The first piece of advice I can offer is to forget
about the idea that we’re going to get into a trend at the beginning. Trying to
make that kind of call is too tricky and just too unreliable to risk our money
on.
So, if we’re looking for an established trend, then
we don’t need to fret about the fact that a lagging indicator is delayed –
because we’re not looking for an early entry.
What we DO
want is reassurance that this trend isn’t about to turn again.
Cue … the
leading indicator to give us reassurance that there’s momentum/volume/market
sentiment behind the move.
And there we
have the recipe for a successful signal …
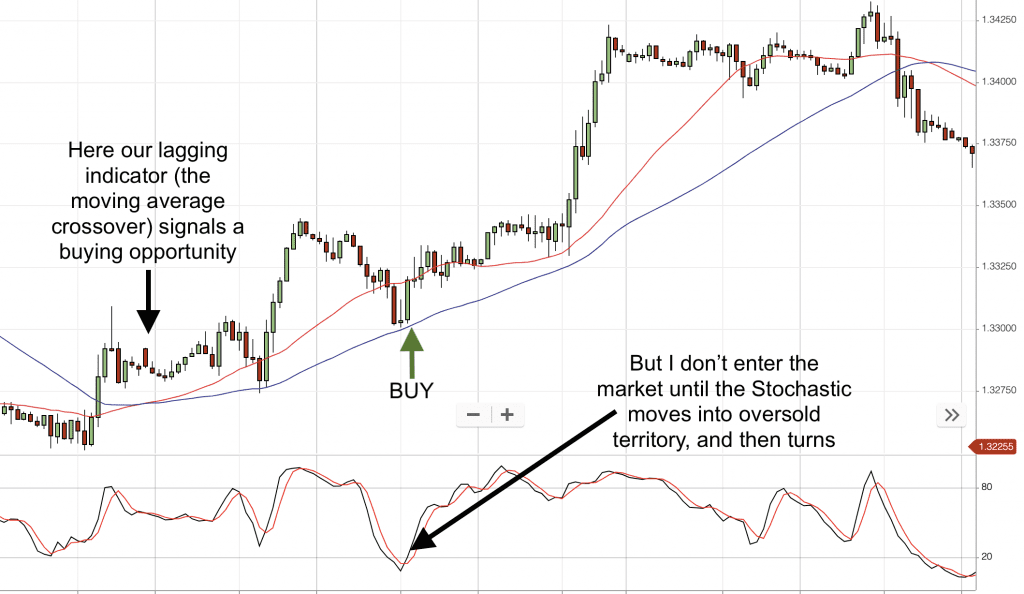
Lagging indicator confirms trend
Leading indicator confirms timing into that trend
On the chart below, we get the trend signalled by the moving average crossover, but we aren’t rushing to get into this trend (we know we’re late to this party already, so we’ll only enter if we’re confident it’ll run). When the Stochastic reading moves into oversold territory, and then starts to climb back up – that’s our trigger to buy …
The perfect
signal
And let’s not lose sight of the fact that – lagging
or leading – these tools are all looking at what’s happened, and using that
information to give guidance about the future. Past price behaviour is
fundamental to both types of indicator. That’s what chart analysis is all
about.
Of course, there’s no ‘perfect’ signal – they’re all fallible. Which is why we also need some good trade management to cut losses when we get it wrong, and to maximize profits when we get it right. Intelligent trailing stops are a great tool for this – you can find much more information on how to employ these HERE.