6 Easy Technical Trailing Stop Tricks that’ll beat the ‘auto’ version every time
Trailing stops are a great trading tool, enabling us to cut risk, lock in profits, and generally sleep better at night.
But the automated trailing stop tool that your broker offers is a very blunt instrument, and is likely to cost us money rather than save it. That’s why I want to show you a better way – applying a technical trailing stop (don’t worry – there are some very simple tools here to help you do it).
Here’s what goes wrong with basic trailing stops …
Automated trailing stops that are just dragged along, ‘X’ points behind the current price, can leave us with stop levels in very vulnerable places. If there’s any volatility on the price, they’ll come a cropper.
The trailing stop tricks I want to show you here are still simple tools that allow you to follow the profits, but without blindly trailing prices and getting bumped out at every jolt in the road. Plus, they have the advantage that they give you clear levels – there’s no trying to draw trend lines or channels here – just a click of a button, and a level appears on your chart.
Yes, they do take some more managing than a set-and-forget stop, but if you’re trading on longer timeframes, that shouldn’t be too tough.
I’m going to show each of these on a 4-hourly EURCHF chart, so you can compare them easily …
1. Parabolic SAR
The parabolic ‘stop and reverse’ system is based on the highest price reached in an uptrend or the lowest price in a downtrend. It was developed specifically for traders to use as a stop level for trades.
2. ATR bands
The Average True Range is a number calculated as the average move the price has made over X number of pervious candlesticks. The ATR bands neatly plot a multiple of this point distance for you from the current price (in fact, you can choose to plot these from open, close, highs, lows or technical indicators).
It gives us a nice visual level to plot our trailing stops on …
The higher number you calculate the ATR over, the smoother the line will be. To make the stop tighter, you can just reduce the multiple used. Or, for a wider stop, increase the multiple. In the example above, the ATR is calculated over 5 periods, and the multiple is 3. So, this means that if the average range of the last 5 candles is 15 pips, then the ATR band will be plotted 45 pips away.
Using an ATR to calculate your stop distance is a good way to incorporate the effects of recent volatility on your trade.
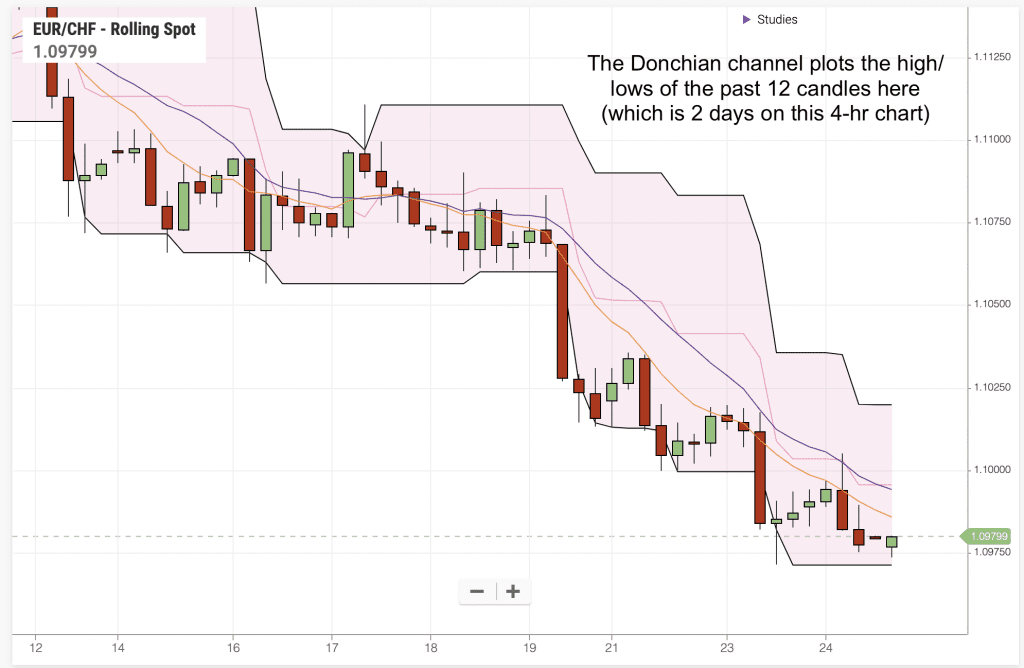
3. Donchian channels
If you’d like to use recent highs or lows to plot your trailing stops by, the Donchian channel is an easy way to add this visually to your charts. It’s a very simple tool that draws a line from the most recent high and low over the past ‘X’ number of candlesticks …
4. Moving average
A moving average can be a useful trailing stop when we have an established trend. However, when a trend is just developing, it’s likely to be too tight …
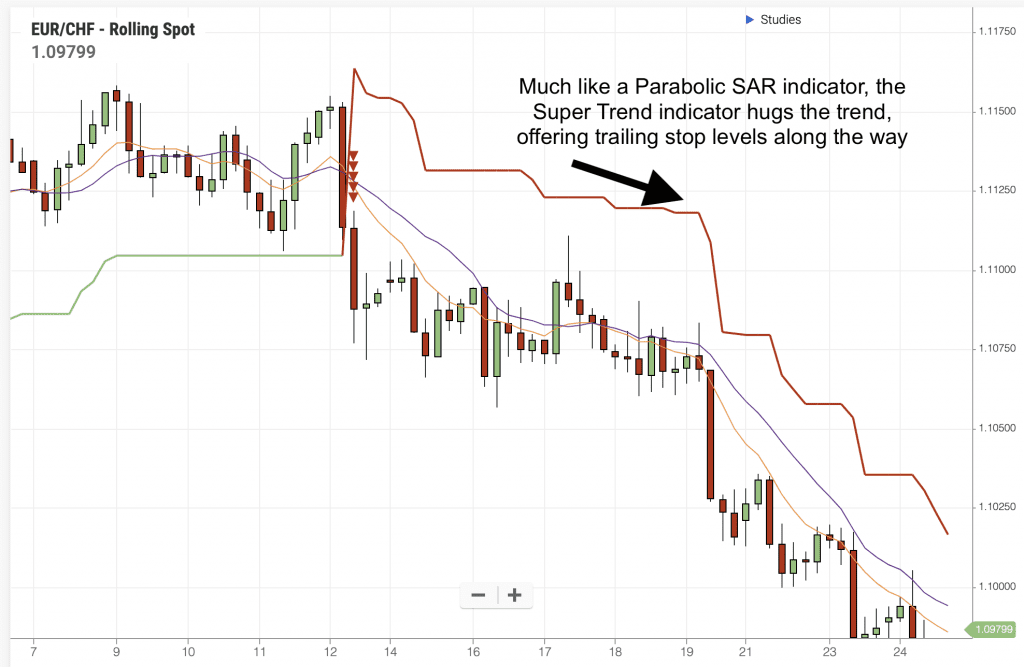
5. Supertrend
The Supertrend indicator is one of the functional all-in-one tools that does everything for you – it gives you buy/sell signals and tells you where to exit those moves.
However, I’m deeply suspicious of any indicator which either has you in a sell trade or a buy trade at any time – I definitely don’t want to be in the market all the time. Just because a buy trade has run out of juice, doesn’t mean that we want to be in a sell!
But we don’t have to use it that way – we can choose to just use its trailing stop facility …
6. Keltner Channel
The Keltner Channel is a variation on the ATR bands – it combines a moving average with the average true range to plot a channel either side of the price. We can adjust how many periods we want the moving average and ATR calculated over, and how many multiples of the ATR away from the moving average to plot the lines.
In this example, the moving average period is 30, and the ATR multiple is 3. This means that the channel shows 3 times the ATR distance from a 30-period exponential moving average …
How to manage ‘smart’ technical trailing stop loss
The problem with using a technical trailing stop, over the simple one-click version on your platform is that it requires a bit more involvement.
Either you’ll need to automate the process on an MT4 platform, or you’ll need to check the new level every time there’s a new candlestick, and adjust your stop in line with it.
That may feel onerous, but if you’re trading on daily or weekly charts, it’s just adapting your trade once a day, or once a week. In fact, 4hourly charts are also manageable – although you may have to accept that stops won’t get tightened on the 2am candle (unless you’re an insomniac). And if you’re trading hourly charts … well, if you’re anything like me, you’re probably checking up on positions multiple times during the day, so there are plenty of opportunities to nip in there to cut risk, and lock in profits.
If you have any other trailing stop tools that work for you, please share in the comments section below.