June 7, 2013by Mark Rose- 0 comments
Using moving averages
When prices aren’t consolidating – they are moving, either up or down. And when a price is on the move in a particular direction, it is said to be “trending”.
Judging a market trend is very important to traders – as these are the moves we want to be trading in the direction of. When the price is trending upwards – we want to be buying. When it’s trending downwards, we want to be selling.
But spotting trends isn’t always as simple as it might sound. Because we need to be aware of when the trend might be over, so we don’t get caught out by direction changes.
The next piece of technical analysis that I want to show you will help you to identify trends – to know when they are about start, and when they are running out of steam.
These lines are called moving averages, and they are one of the simplest and most powerful pieces of technical analysis a trader can use …
When you look at the charting package from your broker, there should be an option to put moving averages on your chart – and it’ll ask you what number of periods you want that moving average to be based on …
A simple moving average is created by adding up the closing prices of “x” number of periods, and then dividing them by “x”. So, a 200-period MA is the average closing price over 200 periods (candlesticks); the 50-period MA is the average closing price over 50 periods … and so on.
The lines these figures plot onto a chart will show us trends, with the daily “noise” of price wobbles taken out. A 20-period MA will show the short-term trend; the 50-period MA will show the medium-term trend; and the 200-period MA will show the long-term market trend.
Because moving averages are created by looking at past data, they are what are called “lagging indicators” – i.e. they tell us about what has happened, rather than about what is going to happen. But that doesn’t mean that they can’t help us to make a judgment on what the price might do.
When a price is in an uptrend, it is most likely to be sitting above the moving average line. When it’s in a downtrend, it’ll be below the moving average.
Therefore, when a price crosses a moving average line – it suggests that a trend change has occurred. This is called a moving average crossover, and is one of the most basic technical signals a trader can use.
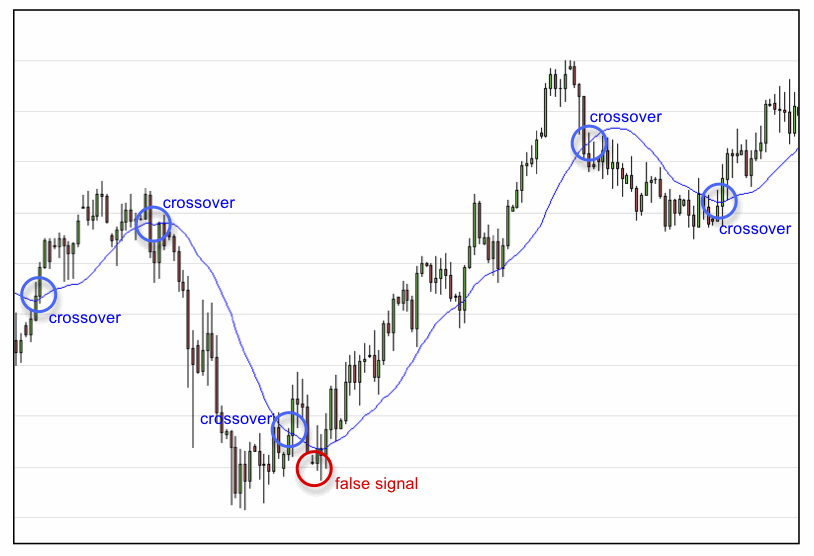
However, I want to show you a more powerful crossover signal, that shows how two moving averages are better than one …
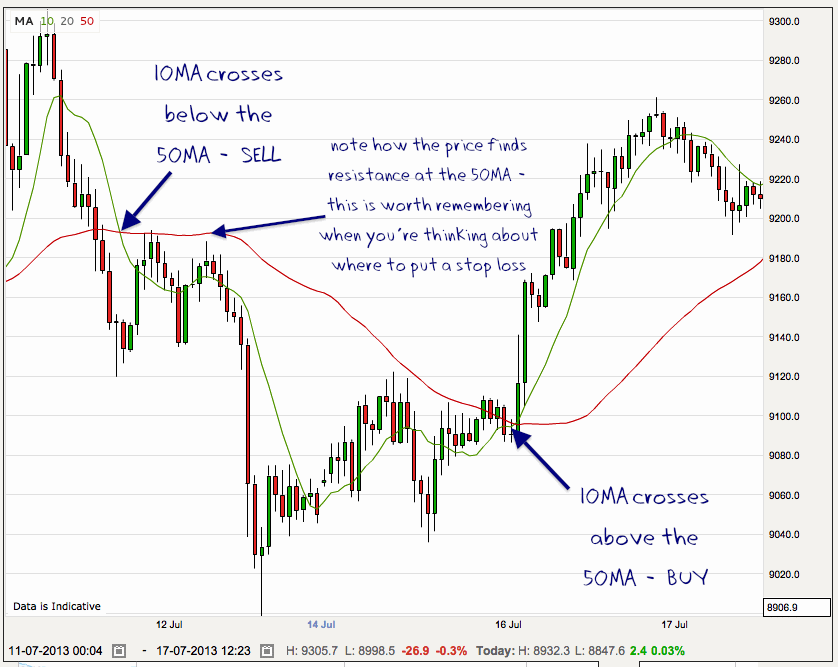
In this example, we have two moving averages on my chart: the 10MA and 50MA. For a signal to SELL, I’m going to wait for the 10MA to move below the 50MA. For a signal to BUY, I’ll wait for the 10MA to move above the 50MA …
If one MA is good, and two are better – why not use three, or four, or twenty?
Sticking a whole bunch of moving averages onto your charts is called a moving average ribbon, and you can see why:

It definitely looks quite pretty – but just how helpful is it?
You can clearly see on these charts how the shorter-term MAs react much more quickly to a trend change than a longer-term MA – and the ribbon allows you to judge your trade timing accordingly.
This gets to the rub with moving averages – the shorter-term ones give us an earlier signal, but can be prone to false signals. The longer-term ones are more reliable, but a later entry means missed profits.
In a bid to get around this problem, many traders apply filters …
The envelope
By adding a further criteria, traders hope to filter out whipsaws on moving average crossovers. Therefore, you can add an envelope around the MA line. For example, you could require that a price must cross the 20-day moving average PLUS be a further 5% above that line before you will place your trade.
The result is that your moving average line instead becomes a channel that the price moves within – it the price breaks out of this channel, then a trend change is indicated.
It is exactly this theory that John Bollinger enhanced in the 1980s to create Bollinger bands. If you’re interested in finding out more about Bollinger bands, I recommend that you have a quick glance back though our Trader’s Bulletin archives: click here.







