A multiple timeframe strategy simply means that you’re looking at more than one chart to get your trading signals.
When it comes to trading, there are also pros and cons with seeing the big picture vs getting close-up to the action. Looking at more than one time frame can easily become overwhelming, but if it’s done right, it’ll give you the best entries and the best profits.
There are two really powerful benefits that come from a multiple timeframe strategy …
adding a longer time frame gives you confirmation of a trend direction.
adding a shorter time frame gives a more accurate (and faster) trade entry.
It’s a win-win.
Here’s how it works …
Multiple timeframe strategy for confirmation
The trading wisdom tells us that we should always
trade with the trend.
While I don’t always follow this, I do react
differently to signals that are with the trend to those against it. There’s
good reason to believe that markets will run further, offering up better
returns and a better risk-reward balance if we trade with the trend.
So we should be aware of long-term trend whenever we
enter the market.
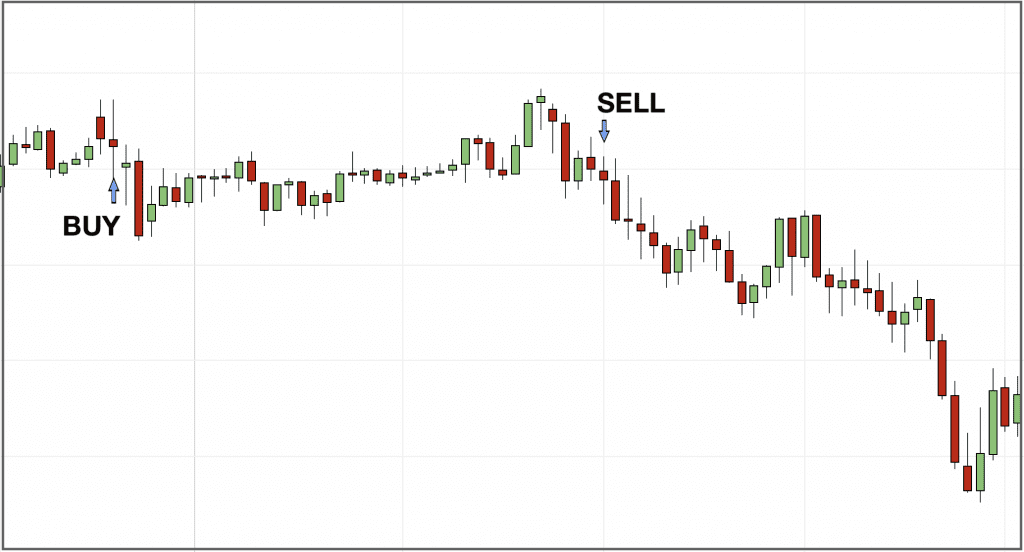
Here’s an example showing two signals, one buy and one sell, generated by a strategy based on MACD and Stochastics on a 15 minute time frame …
It’s clear (in retrospect) that the sell trade here
has much greater profit potential.
By looking at a longer time frame to judge the overall trend, like this 4-hour chart below, it becomes obvious that a sell trade would be preferable here …
So, a glance at a longer time frame can ensure that
we’re able to run our profits with the trend.
However, there’s a short-cut we can take here – by
using longer moving averages on our charts.
The two moving averages showing on that 4-hourly chart
above are 10SMA and 18SMA.
We can create the same effect by multiplying up our
moving average across the timeframe. So, if we have a 10SMA on the 4 hourly
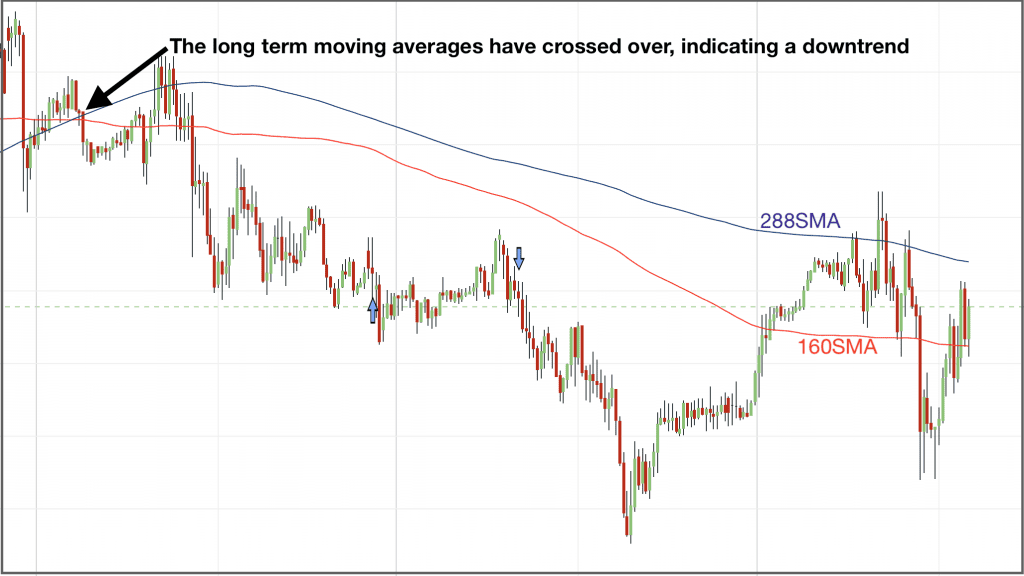
chart, that’ll translate as a 160SMA on the 15 minute chart …
10 x 4(hrs) x 4(15mins/hr) = 160 SMA 18 x 4(hrs) x 4(15mins/hr) = 288 SMA
So, adding 160SMA and 288SMA on our 15 minute chart means that we can do our multiple timeframe analysis, without ever switching charts …
So, that’s the first multiple timeframe strategy win.
The second comes with honing the perfect entry …
Multiple timeframe strategy for trade entries
I’m not an advocate of rushing into trades without
proper confirmation … but … if you can get that confirmation sooner, then you
should be in at a better price and get a better return for your investment.
I expect you’re all too familiar with waiting for
trade confirmation. The price has hit the level or the signal has been triggered
for your trade … but you’re waiting for the candlestick to close and confirm
the trade. Unless you’re trading on the shortest timeframes, this can feel like
a torturous wait, watching your profits being eaten into as the price ticks
along in the right direction.
By switching into a shorter timeframe, we can do two
things …
Get early confirmation as shorter candlesticks close to confirm our move.
Find stronger confirmation from price action in the shorter timeframe.
Here’s another example, where I’ve got a buy signal from my MACD and Stochastic indicators …
I need to wait for the 15 minute candlestick to close
to confirm the crossover signal. As you can see, this’ll involve sitting and
watching the price move upwards, without getting any of those profits.
So, instead, I’ll zoom into a shorter timeframe. Here’s the 1 minute chart …
Here I can see the 7.14 candle has formed a doji, and
the 7.15 and 7.16 candlesticks are moving strongly away. If I enter at 7.17am,
I’m potentially giving myself an extra 8.5 pips in profit on this trade.
Shorter timeframes will have more ‘noise’ – they are
filled with all the bumps and twists in the markets. So bear in mind that
faster entries like this will always make us more vulnerable to false signals,
but this is balanced against the better risk-reward profile this method can
produce. And nice price action set-up is a great way to enter a trade.
But what about when timeframes don’t agree?
Trading across multiple timeframes is all about looking
for agreement between them. Naturally, this means that you’ll also find
conflict.
Your 15 minute chart may say ‘buy’, while your 4
hourly chart says ‘sell’ … and your 1 minute chart shows the price stuck
sideways.
Bumping up against these conflicts will often lead
traders to dismiss multiple timeframe analysis. While this philosophy may sound like the trading
equivalent of sticking your fingers in your ears and singing “La, la, la, I
can’t hear you!” – it’s not without its merits.
By sticking to one
timeframe, you can become an expert in that frame, learning what sort of range
of movement to expect within the timescale of your trade. It’s very important
to match the timeframe you’re trading to your trading style – if you’re looking
for big moves of 100+ pips, then you won’t find these on a 5-minute chart.
Instead, you’ll need to be looking at hourlies or dailies. If you’re trying to
scalp 5–10 points, on the other hand, an hourly chart won’t give you the kind
of accuracy that you need.
So, even if you are using
multiple timeframes as part of your analysis, it’s important to have a key
timeframe that matches your trading style – this will give you your signals.
(Extra timeframes are for confirmation or faster entry.)
When you do hit conflicts, don’t be afraid to reject
trades. Multiple timeframe trading should mean fewer trades, but an improved
reward-to-risk ratio as you push your profits further.
And, as always, monitor your results to see the impact
it’s having on your trading performance.
I’m looking forward to showing you very soon how I’ve managed to automate this process in my Bread & Butter Trading strategy!
I have always used a factor of between 4 and 6 when using timeframe analysis in order to keep it more relevant to my trading timeframe. So If I was trading on 15 minutes I would look at the 1 hour, not the 4 hour.
Also, just wondering what youre using as a signal from the MACD and Stochastic indicators?













2 comments
Adam
Another great post!
I have always used a factor of between 4 and 6 when using timeframe analysis in order to keep it more relevant to my trading timeframe. So If I was trading on 15 minutes I would look at the 1 hour, not the 4 hour.
Also, just wondering what youre using as a signal from the MACD and Stochastic indicators?
Fadi Dawood
Excellent post as always Mark. Thank you, I’ve always wanted to how to analyze multiple time frames while sticking to one timeframe.